Malaysian vs Apache Hearing Disability
COMPARE
Malaysian
Apache
Hearing Disability
Hearing Disability Comparison
Malaysians
Apache
3.2%
HEARING DISABILITY
6.6/ 100
METRIC RATING
220th/ 347
METRIC RANK
4.1%
HEARING DISABILITY
0.0/ 100
METRIC RATING
323rd/ 347
METRIC RANK
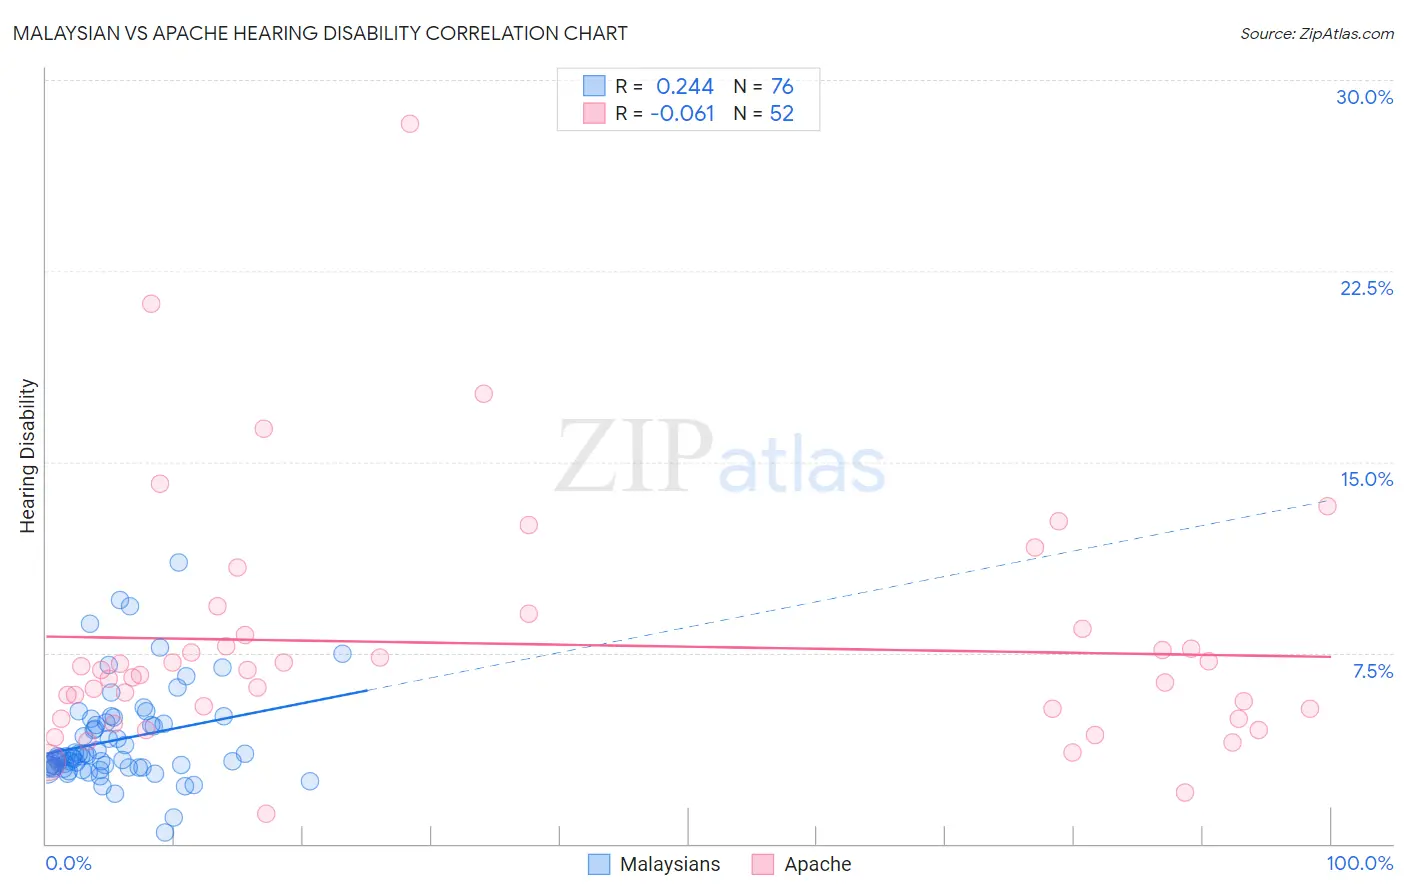
Malaysian vs Apache Hearing Disability Correlation Chart
The statistical analysis conducted on geographies consisting of 226,034,650 people shows a weak positive correlation between the proportion of Malaysians and percentage of population with hearing disability in the United States with a correlation coefficient (R) of 0.244 and weighted average of 3.2%. Similarly, the statistical analysis conducted on geographies consisting of 231,022,751 people shows a slight negative correlation between the proportion of Apache and percentage of population with hearing disability in the United States with a correlation coefficient (R) of -0.061 and weighted average of 4.1%, a difference of 28.6%.
Hearing Disability Correlation Summary
| Measurement | Malaysian | Apache |
| Minimum | 0.43% | 1.2% |
| Maximum | 11.0% | 28.3% |
| Range | 10.6% | 27.1% |
| Mean | 4.1% | 7.8% |
| Median | 3.4% | 6.7% |
| Interquartile 25% (IQ1) | 3.0% | 5.1% |
| Interquartile 75% (IQ3) | 4.8% | 8.3% |
| Interquartile Range (IQR) | 1.7% | 3.2% |
| Standard Deviation (Sample) | 1.9% | 4.8% |
| Standard Deviation (Population) | 1.9% | 4.8% |
Similar Demographics by Hearing Disability
Demographics Similar to Malaysians by Hearing Disability
In terms of hearing disability, the demographic groups most similar to Malaysians are Immigrants from Laos (3.2%, a difference of 0.0%), Immigrants from Oceania (3.2%, a difference of 0.040%), New Zealander (3.2%, a difference of 0.060%), Immigrants from Northern Europe (3.2%, a difference of 0.12%), and Russian (3.2%, a difference of 0.16%).
| Demographics | Rating | Rank | Hearing Disability |
| Immigrants | Iraq | 10.5 /100 | #213 | Poor 3.1% |
| Australians | 8.1 /100 | #214 | Tragic 3.2% |
| Bangladeshis | 8.1 /100 | #215 | Tragic 3.2% |
| Immigrants | Norway | 7.3 /100 | #216 | Tragic 3.2% |
| Russians | 7.1 /100 | #217 | Tragic 3.2% |
| Immigrants | Northern Europe | 7.0 /100 | #218 | Tragic 3.2% |
| New Zealanders | 6.8 /100 | #219 | Tragic 3.2% |
| Malaysians | 6.6 /100 | #220 | Tragic 3.2% |
| Immigrants | Laos | 6.6 /100 | #221 | Tragic 3.2% |
| Immigrants | Oceania | 6.5 /100 | #222 | Tragic 3.2% |
| Mexicans | 5.6 /100 | #223 | Tragic 3.2% |
| Icelanders | 5.2 /100 | #224 | Tragic 3.2% |
| Latvians | 5.1 /100 | #225 | Tragic 3.2% |
| Lebanese | 5.0 /100 | #226 | Tragic 3.2% |
| Bhutanese | 4.6 /100 | #227 | Tragic 3.2% |
Demographics Similar to Apache by Hearing Disability
In terms of hearing disability, the demographic groups most similar to Apache are Osage (4.1%, a difference of 0.070%), Seminole (4.1%, a difference of 0.12%), Paiute (4.1%, a difference of 0.38%), Lumbee (4.1%, a difference of 0.39%), and Potawatomi (4.1%, a difference of 0.68%).
| Demographics | Rating | Rank | Hearing Disability |
| Spanish Americans | 0.0 /100 | #316 | Tragic 4.0% |
| Comanche | 0.0 /100 | #317 | Tragic 4.0% |
| Cheyenne | 0.0 /100 | #318 | Tragic 4.0% |
| Chippewa | 0.0 /100 | #319 | Tragic 4.0% |
| Shoshone | 0.0 /100 | #320 | Tragic 4.0% |
| Paiute | 0.0 /100 | #321 | Tragic 4.1% |
| Seminole | 0.0 /100 | #322 | Tragic 4.1% |
| Apache | 0.0 /100 | #323 | Tragic 4.1% |
| Osage | 0.0 /100 | #324 | Tragic 4.1% |
| Lumbee | 0.0 /100 | #325 | Tragic 4.1% |
| Potawatomi | 0.0 /100 | #326 | Tragic 4.1% |
| Arapaho | 0.0 /100 | #327 | Tragic 4.1% |
| Tohono O'odham | 0.0 /100 | #328 | Tragic 4.2% |
| Crow | 0.0 /100 | #329 | Tragic 4.2% |
| Natives/Alaskans | 0.0 /100 | #330 | Tragic 4.2% |