Pennsylvania German vs Apache Hearing Disability
COMPARE
Pennsylvania German
Apache
Hearing Disability
Hearing Disability Comparison
Pennsylvania Germans
Apache
3.7%
HEARING DISABILITY
0.0/ 100
METRIC RATING
301st/ 347
METRIC RANK
4.1%
HEARING DISABILITY
0.0/ 100
METRIC RATING
323rd/ 347
METRIC RANK
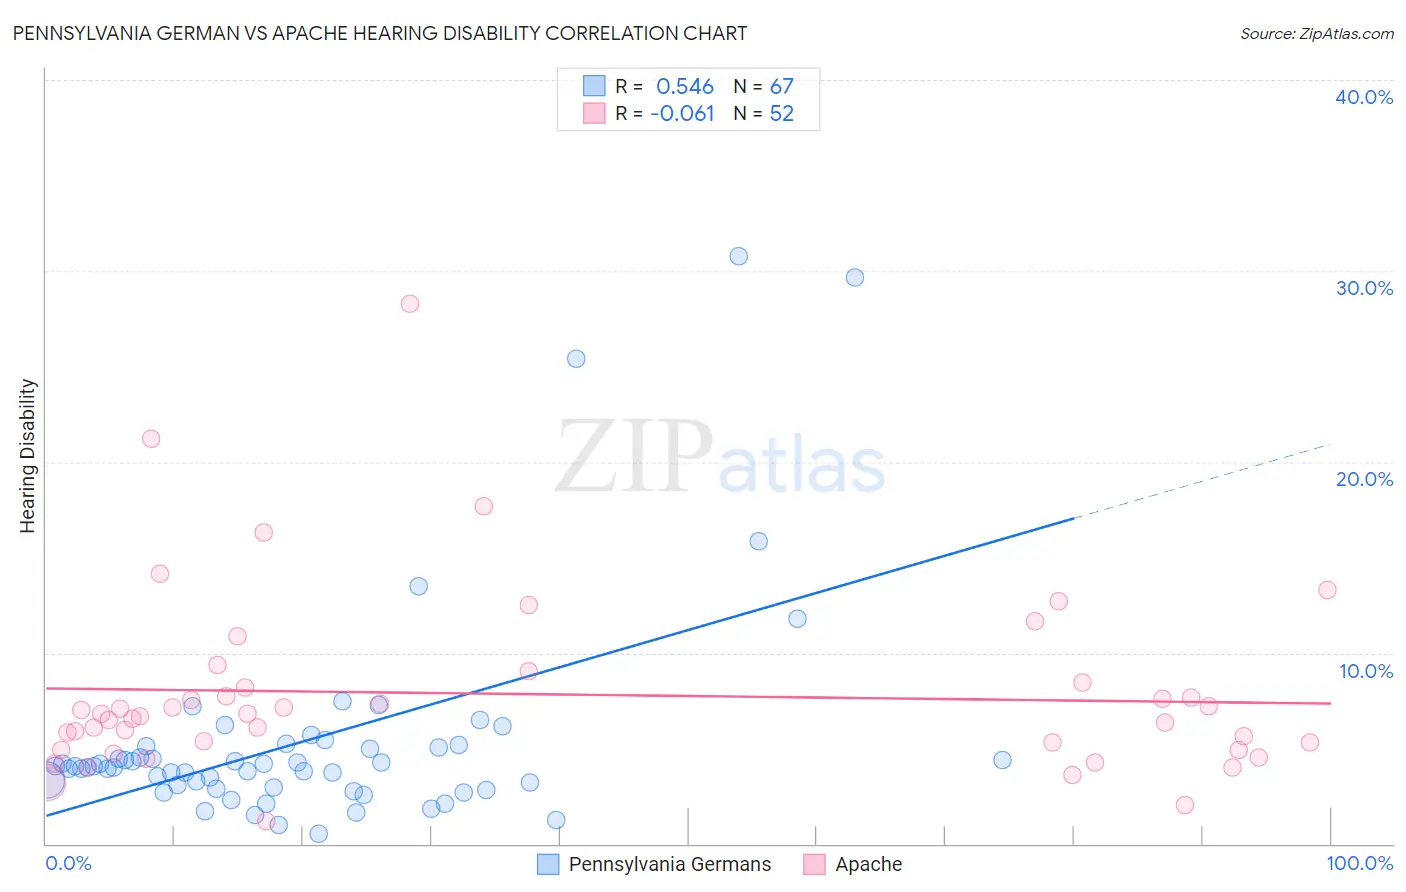
Pennsylvania German vs Apache Hearing Disability Correlation Chart
The statistical analysis conducted on geographies consisting of 234,065,533 people shows a substantial positive correlation between the proportion of Pennsylvania Germans and percentage of population with hearing disability in the United States with a correlation coefficient (R) of 0.546 and weighted average of 3.7%. Similarly, the statistical analysis conducted on geographies consisting of 231,022,751 people shows a slight negative correlation between the proportion of Apache and percentage of population with hearing disability in the United States with a correlation coefficient (R) of -0.061 and weighted average of 4.1%, a difference of 9.5%.
Hearing Disability Correlation Summary
| Measurement | Pennsylvania German | Apache |
| Minimum | 0.51% | 1.2% |
| Maximum | 30.8% | 28.3% |
| Range | 30.3% | 27.1% |
| Mean | 5.4% | 7.8% |
| Median | 4.0% | 6.7% |
| Interquartile 25% (IQ1) | 3.0% | 5.1% |
| Interquartile 75% (IQ3) | 5.1% | 8.3% |
| Interquartile Range (IQR) | 2.1% | 3.2% |
| Standard Deviation (Sample) | 5.7% | 4.8% |
| Standard Deviation (Population) | 5.6% | 4.8% |
Similar Demographics by Hearing Disability
Demographics Similar to Pennsylvania Germans by Hearing Disability
In terms of hearing disability, the demographic groups most similar to Pennsylvania Germans are Scottish (3.7%, a difference of 0.030%), German (3.7%, a difference of 0.090%), Dutch (3.7%, a difference of 0.11%), Menominee (3.7%, a difference of 0.16%), and Celtic (3.7%, a difference of 0.37%).
| Demographics | Rating | Rank | Hearing Disability |
| Iroquois | 0.0 /100 | #294 | Tragic 3.7% |
| Welsh | 0.0 /100 | #295 | Tragic 3.7% |
| Pima | 0.0 /100 | #296 | Tragic 3.7% |
| Immigrants | Azores | 0.0 /100 | #297 | Tragic 3.7% |
| Celtics | 0.0 /100 | #298 | Tragic 3.7% |
| Germans | 0.0 /100 | #299 | Tragic 3.7% |
| Scottish | 0.0 /100 | #300 | Tragic 3.7% |
| Pennsylvania Germans | 0.0 /100 | #301 | Tragic 3.7% |
| Dutch | 0.0 /100 | #302 | Tragic 3.7% |
| Menominee | 0.0 /100 | #303 | Tragic 3.7% |
| French | 0.0 /100 | #304 | Tragic 3.8% |
| English | 0.0 /100 | #305 | Tragic 3.8% |
| Marshallese | 0.0 /100 | #306 | Tragic 3.8% |
| French Canadians | 0.0 /100 | #307 | Tragic 3.8% |
| Ottawa | 0.0 /100 | #308 | Tragic 3.8% |
Demographics Similar to Apache by Hearing Disability
In terms of hearing disability, the demographic groups most similar to Apache are Osage (4.1%, a difference of 0.070%), Seminole (4.1%, a difference of 0.12%), Paiute (4.1%, a difference of 0.38%), Lumbee (4.1%, a difference of 0.39%), and Potawatomi (4.1%, a difference of 0.68%).
| Demographics | Rating | Rank | Hearing Disability |
| Spanish Americans | 0.0 /100 | #316 | Tragic 4.0% |
| Comanche | 0.0 /100 | #317 | Tragic 4.0% |
| Cheyenne | 0.0 /100 | #318 | Tragic 4.0% |
| Chippewa | 0.0 /100 | #319 | Tragic 4.0% |
| Shoshone | 0.0 /100 | #320 | Tragic 4.0% |
| Paiute | 0.0 /100 | #321 | Tragic 4.1% |
| Seminole | 0.0 /100 | #322 | Tragic 4.1% |
| Apache | 0.0 /100 | #323 | Tragic 4.1% |
| Osage | 0.0 /100 | #324 | Tragic 4.1% |
| Lumbee | 0.0 /100 | #325 | Tragic 4.1% |
| Potawatomi | 0.0 /100 | #326 | Tragic 4.1% |
| Arapaho | 0.0 /100 | #327 | Tragic 4.1% |
| Tohono O'odham | 0.0 /100 | #328 | Tragic 4.2% |
| Crow | 0.0 /100 | #329 | Tragic 4.2% |
| Natives/Alaskans | 0.0 /100 | #330 | Tragic 4.2% |