Immigrants from South Africa vs Danish Disability Age 35 to 64

COMPARE

Immigrants from South Africa
Race
Ancestry
AfghanAfricanAlaska NativeAlaskan AthabascanAlbanianAleutAlsatianAmericanApacheArabArapahoArgentineanArmenianAssyrian/Chaldean/SyriacAustralianAustrianBahamianBangladeshiBarbadianBasqueBelgianBelizeanBermudanBhutaneseBlackfeetBolivianBrazilianBritishBritish West IndianBulgarianBurmeseCajunCambodianCanadianCape VerdeanCarpatho RusynCelticCentral AmericanCentral American IndianCherokeeCheyenneChickasawChileanChineseChippewaChoctawColombianColvilleComancheCosta RicanCreeCreekCroatianCrowCubanCypriotCzechCzechoslovakianDelawareDominicanDutchDutch West IndianEastern EuropeanEcuadorianEgyptianEnglishEstonianEthiopianEuropeanFijianFilipinoFinnishFrenchFrench American IndianFrench CanadianGermanGerman RussianGhanaianGreekGuamanian/ChamorroGuatemalanGuyaneseHaitianHmongHonduranHopiHoumaHungarianIcelanderIndian (Asian)IndonesianInupiatIranianIraqiIrishIroquoisIsraeliItalianJamaicanJapaneseJordanianKenyanKiowaKoreanLaotianLatvianLebaneseLiberianLithuanianLumbeeLuxembourgerMacedonianMalaysianMalteseMarshalleseMenomineeMexicanMexican American IndianMongolianMoroccanNative HawaiianNavajoNepaleseNew ZealanderNicaraguanNigerianNorthern EuropeanNorwegianOkinawanOsageOttawaPaiutePakistaniPalestinianPanamanianParaguayanPennsylvania GermanPeruvianPimaPolishPortuguesePotawatomiPuebloPuerto RicanPuget Sound SalishRomanianRussianSalvadoranSamoanScandinavianScotch-IrishScottishSeminoleSenegaleseSerbianShoshoneSierra LeoneanSiouxSlavicSlovakSloveneSomaliSouth AfricanSouth AmericanSouth American IndianSoviet UnionSpaniardSpanishSpanish AmericanSpanish American IndianSri LankanSubsaharan AfricanSudaneseSwedishSwissSyrianTaiwaneseThaiTlingit-HaidaTohono O'OdhamTonganTrinidadian and TobagonianTsimshianTurkishU.S. Virgin IslanderUgandanUkrainianUruguayanUteVenezuelanVietnameseWelshWest IndianYakamaYaquiYugoslavianYumanYup'ikZimbabwean
Immigration
NonimmigrantsImmigrantsAfghanistanAfricaAlbaniaArgentinaArmeniaAsiaAustraliaAustriaBahamasBangladeshBarbadosBelarusBelgiumBelizeBoliviaBosnia and HerzegovinaBrazilBulgariaBurma/MyanmarCabo VerdeCambodiaCameroonCanadaCaribbeanCentral AmericaChileChinaColombiaCongoCosta RicaCroatiaCubaCzechoslovakiaDenmarkDominicaDominican RepublicEastern AfricaEastern AsiaEastern EuropeEcuadorEgyptEl SalvadorEnglandEritreaEthiopiaEuropeFijiFranceGermanyGhanaGreeceGrenadaGuatemalaGuyanaHaitiHondurasHong KongHungaryIndiaIndonesiaIranIraqIrelandIsraelItalyJamaicaJapanJordanKazakhstanKenyaKoreaKuwaitLaosLatin AmericaLatviaLebanonLiberiaLithuaniaMalaysiaMexicoMicronesiaMiddle AfricaMoldovaMoroccoNepalNetherlandsNicaraguaNigeriaNorth AmericaNorth MacedoniaNorthern AfricaNorthern EuropeNorwayOceaniaPakistanPanamaPeruPhilippinesPolandPortugalRomaniaRussiaSaudi ArabiaScotlandSenegalSerbiaSierra LeoneSingaporeSomaliaSouth AfricaSouth AmericaSouth Central AsiaSouth Eastern AsiaSouthern EuropeSpainSri LankaSt. Vincent and the GrenadinesSudanSwedenSwitzerlandSyriaTaiwanThailandTrinidad and TobagoTurkeyUgandaUkraineUruguayUzbekistanVenezuelaVietnamWest IndiesWestern AfricaWestern AsiaWestern EuropeYemenZaireZimbabweAzores
Danish
Race
Ancestry
AfghanAfricanAlaska NativeAlaskan AthabascanAlbanianAleutAlsatianAmericanApacheArabArapahoArgentineanArmenianAssyrian/Chaldean/SyriacAustralianAustrianBahamianBangladeshiBarbadianBasqueBelgianBelizeanBermudanBhutaneseBlackfeetBolivianBrazilianBritishBritish West IndianBulgarianBurmeseCajunCambodianCanadianCape VerdeanCarpatho RusynCelticCentral AmericanCentral American IndianCherokeeCheyenneChickasawChileanChineseChippewaChoctawColombianColvilleComancheCosta RicanCreeCreekCroatianCrowCubanCypriotCzechCzechoslovakianDanishDelawareDominicanDutchDutch West IndianEastern EuropeanEcuadorianEgyptianEnglishEstonianEthiopianEuropeanFijianFilipinoFinnishFrenchFrench American IndianFrench CanadianGermanGerman RussianGhanaianGreekGuamanian/ChamorroGuatemalanGuyaneseHaitianHmongHonduranHopiHoumaHungarianIcelanderIndian (Asian)IndonesianInupiatIranianIraqiIrishIroquoisIsraeliItalianJamaicanJapaneseJordanianKenyanKiowaKoreanLaotianLatvianLebaneseLiberianLithuanianLumbeeLuxembourgerMacedonianMalaysianMalteseMarshalleseMenomineeMexicanMexican American IndianMongolianMoroccanNative HawaiianNavajoNepaleseNew ZealanderNicaraguanNigerianNorthern EuropeanNorwegianOkinawanOsageOttawaPaiutePakistaniPalestinianPanamanianParaguayanPennsylvania GermanPeruvianPimaPolishPortuguesePotawatomiPuebloPuerto RicanPuget Sound SalishRomanianRussianSalvadoranSamoanScandinavianScotch-IrishScottishSeminoleSenegaleseSerbianShoshoneSierra LeoneanSiouxSlavicSlovakSloveneSomaliSouth AfricanSouth AmericanSouth American IndianSoviet UnionSpaniardSpanishSpanish AmericanSpanish American IndianSri LankanSubsaharan AfricanSudaneseSwedishSwissSyrianTaiwaneseThaiTlingit-HaidaTohono O'OdhamTonganTrinidadian and TobagonianTsimshianTurkishU.S. Virgin IslanderUgandanUkrainianUruguayanUteVenezuelanVietnameseWelshWest IndianYakamaYaquiYugoslavianYumanYup'ikZimbabwean
Immigration
NonimmigrantsImmigrantsAfghanistanAfricaAlbaniaArgentinaArmeniaAsiaAustraliaAustriaBahamasBangladeshBarbadosBelarusBelgiumBelizeBoliviaBosnia and HerzegovinaBrazilBulgariaBurma/MyanmarCabo VerdeCambodiaCameroonCanadaCaribbeanCentral AmericaChileChinaColombiaCongoCosta RicaCroatiaCubaCzechoslovakiaDenmarkDominicaDominican RepublicEastern AfricaEastern AsiaEastern EuropeEcuadorEgyptEl SalvadorEnglandEritreaEthiopiaEuropeFijiFranceGermanyGhanaGreeceGrenadaGuatemalaGuyanaHaitiHondurasHong KongHungaryIndiaIndonesiaIranIraqIrelandIsraelItalyJamaicaJapanJordanKazakhstanKenyaKoreaKuwaitLaosLatin AmericaLatviaLebanonLiberiaLithuaniaMalaysiaMexicoMicronesiaMiddle AfricaMoldovaMoroccoNepalNetherlandsNicaraguaNigeriaNorth AmericaNorth MacedoniaNorthern AfricaNorthern EuropeNorwayOceaniaPakistanPanamaPeruPhilippinesPolandPortugalRomaniaRussiaSaudi ArabiaScotlandSenegalSerbiaSierra LeoneSingaporeSomaliaSouth AmericaSouth Central AsiaSouth Eastern AsiaSouthern EuropeSpainSri LankaSt. Vincent and the GrenadinesSudanSwedenSwitzerlandSyriaTaiwanThailandTrinidad and TobagoTurkeyUgandaUkraineUruguayUzbekistanVenezuelaVietnamWest IndiesWestern AfricaWestern AsiaWestern EuropeYemenZaireZimbabweAzores
Disability Age 35 to 64
Income
Poverty
Unemployment
Labor Participation
Family Structure
Vehicle Availability
Education Level
Disability

Disability Age 35 to 64 Comparison

Immigrants from South Africa

Danes

Exceptional
Fair
10.3%
DISABILITY AGE 35 TO 64
98.5/ 100
METRIC RATING
96th/ 347
METRIC RANK
11.4%
DISABILITY AGE 35 TO 64
36.8/ 100
METRIC RATING
185th/ 347
METRIC RANK

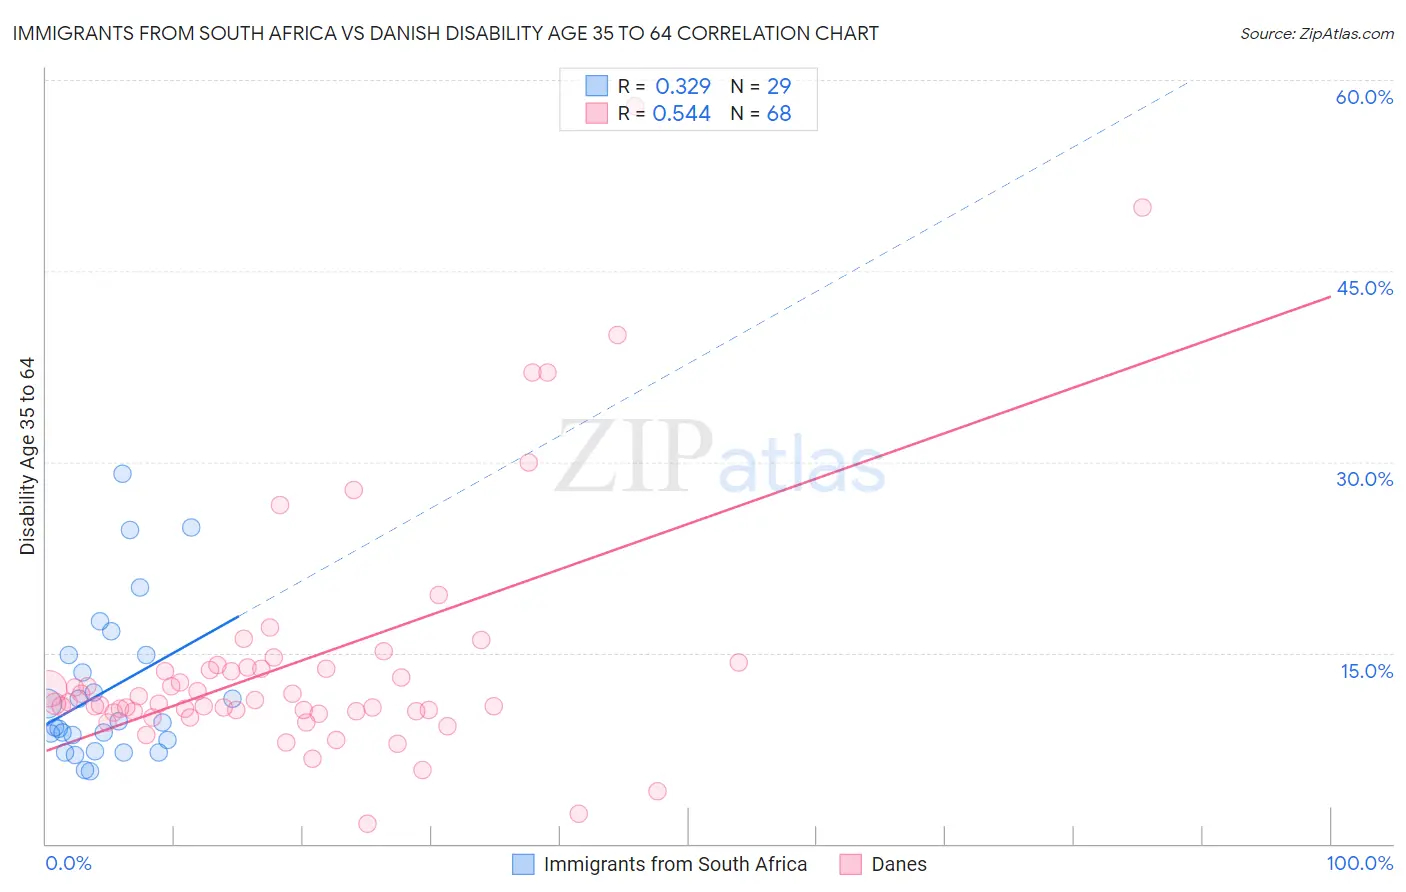
Immigrants from South Africa vs Danish Disability Age 35 to 64 Correlation Chart

The statistical analysis conducted on geographies consisting of 233,242,913 people shows a mild positive correlation between the proportion of Immigrants from South Africa and percentage of population with a disability between the ages 34 and 64 in the United States with a correlation coefficient (R) of 0.329 and weighted average of 10.3%. Similarly, the statistical analysis conducted on geographies consisting of 473,726,380 people shows a substantial positive correlation between the proportion of Danes and percentage of population with a disability between the ages 34 and 64 in the United States with a correlation coefficient (R) of 0.544 and weighted average of 11.4%, a difference of 10.4%.
Immigrants from South Africa vs Danish Disability Age 35 to 64

Disability Age 35 to 64 Correlation Summary

MeasurementImmigrants from South AfricaDanish
Minimum5.7%1.5%
Maximum29.1%57.9%
Range23.4%56.4%
Mean12.0%14.3%
Median9.6%11.1%
Interquartile 25% (IQ1)7.7%10.4%
Interquartile 75% (IQ3)14.8%13.8%
Interquartile Range (IQR)7.1%3.4%
Standard Deviation (Sample)6.1%9.9%
Standard Deviation (Population)6.0%9.9%

Similar Demographics by Disability Age 35 to 64

Demographics Similar to Immigrants from South Africa by Disability Age 35 to 64

In terms of disability age 35 to 64, the demographic groups most similar to Immigrants from South Africa are Immigrants from Denmark (10.3%, a difference of 0.18%), Immigrants from Italy (10.3%, a difference of 0.24%), Chinese (10.3%, a difference of 0.24%), Immigrants from Uruguay (10.3%, a difference of 0.25%), and Immigrants from North Macedonia (10.3%, a difference of 0.28%).
DemographicsRating | RankDisability Age 35 to 64
Uruguayans
99.0
/100
|
#89
Exceptional
10.2%
Afghans
98.9
/100
|
#90
Exceptional
10.3%
Immigrants | Lebanon
98.9
/100
|
#91
Exceptional
10.3%
Immigrants | Northern Africa
98.7
/100
|
#92
Exceptional
10.3%
Immigrants | North Macedonia
98.7
/100
|
#93
Exceptional
10.3%
Immigrants | Italy
98.7
/100
|
#94
Exceptional
10.3%
Chinese
98.7
/100
|
#95
Exceptional
10.3%
Immigrants | South Africa
98.5
/100
|
#96
Exceptional
10.3%
Immigrants | Denmark
98.4
/100
|
#97
Exceptional
10.3%
Immigrants | Uruguay
98.3
/100
|
#98
Exceptional
10.3%
Palestinians
98.2
/100
|
#99
Exceptional
10.4%
Immigrants | Jordan
98.1
/100
|
#100
Exceptional
10.4%
Immigrants | Philippines
98.0
/100
|
#101
Exceptional
10.4%
Immigrants | Western Asia
98.0
/100
|
#102
Exceptional
10.4%
Immigrants | Ukraine
97.9
/100
|
#103
Exceptional
10.4%

Demographics Similar to Danes by Disability Age 35 to 64

In terms of disability age 35 to 64, the demographic groups most similar to Danes are Slovene (11.4%, a difference of 0.010%), Immigrants from Bosnia and Herzegovina (11.4%, a difference of 0.14%), Northern European (11.4%, a difference of 0.16%), Hungarian (11.4%, a difference of 0.19%), and Kenyan (11.4%, a difference of 0.21%).
DemographicsRating | RankDisability Age 35 to 64
Poles
42.0
/100
|
#178
Average
11.3%
Immigrants | Barbados
41.6
/100
|
#179
Average
11.3%
Immigrants | Caribbean
41.5
/100
|
#180
Average
11.3%
Trinidadians and Tobagonians
40.8
/100
|
#181
Average
11.4%
Icelanders
39.7
/100
|
#182
Fair
11.4%
Immigrants | Oceania
39.5
/100
|
#183
Fair
11.4%
Kenyans
39.2
/100
|
#184
Fair
11.4%
Danes
36.8
/100
|
#185
Fair
11.4%
Slovenes
36.6
/100
|
#186
Fair
11.4%
Immigrants | Bosnia and Herzegovina
35.2
/100
|
#187
Fair
11.4%
Northern Europeans
34.9
/100
|
#188
Fair
11.4%
Hungarians
34.6
/100
|
#189
Fair
11.4%
Immigrants | Nigeria
32.5
/100
|
#190
Fair
11.4%
Swedes
31.3
/100
|
#191
Fair
11.4%
Norwegians
29.7
/100
|
#192
Fair
11.5%