Immigrants from Bulgaria vs Immigrants from Sierra Leone In Labor Force | Age 45-54
COMPARE
Immigrants from Bulgaria
Immigrants from Sierra Leone
In Labor Force | Age 45-54
In Labor Force | Age 45-54 Comparison
Immigrants from Bulgaria
Immigrants from Sierra Leone
83.8%
IN LABOR FORCE | AGE 45-54
99.7/ 100
METRIC RATING
30th/ 347
METRIC RANK
84.4%
IN LABOR FORCE | AGE 45-54
100.0/ 100
METRIC RATING
9th/ 347
METRIC RANK
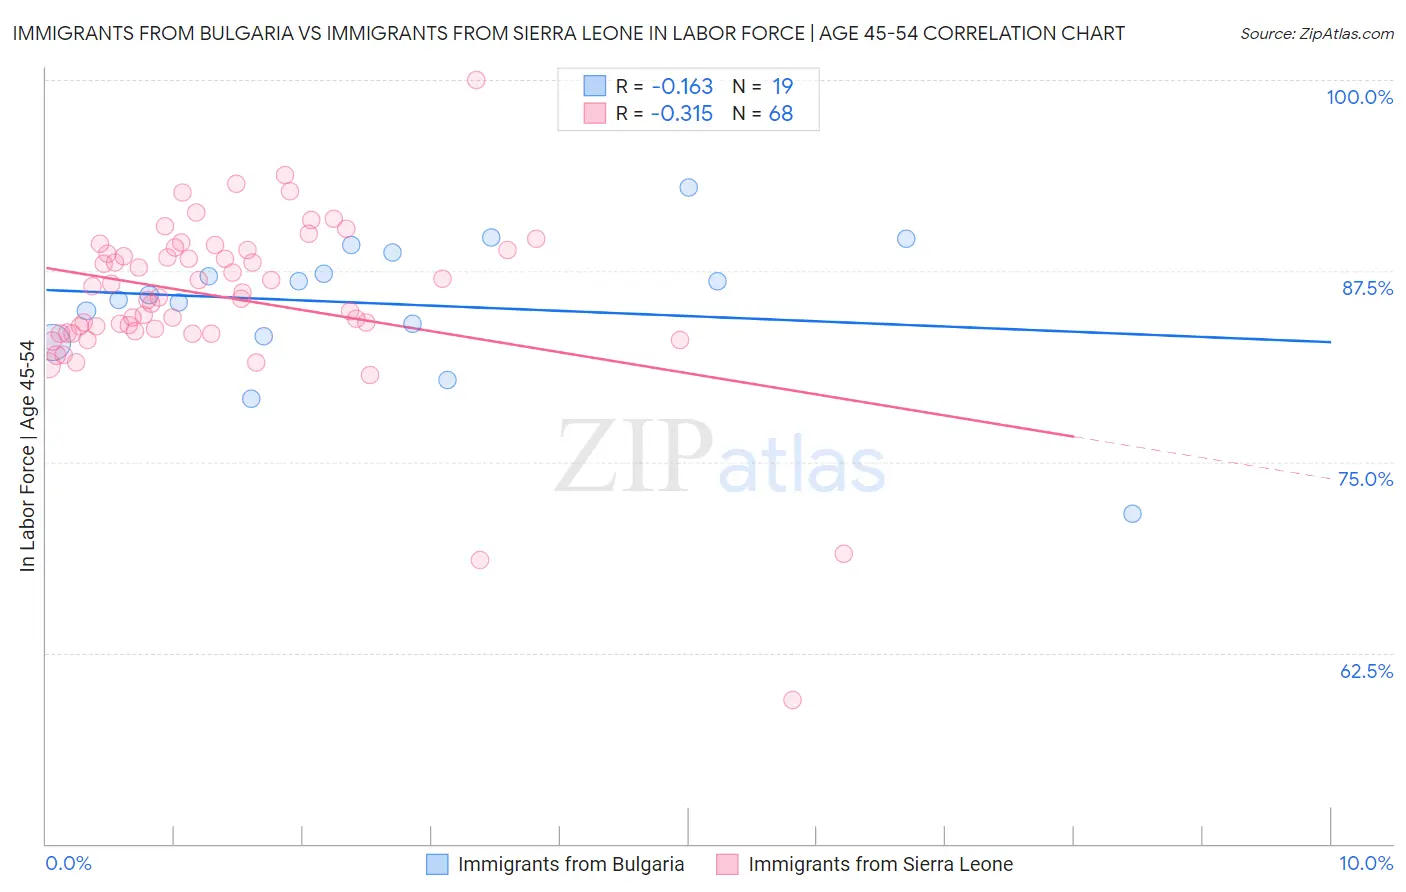
Immigrants from Bulgaria vs Immigrants from Sierra Leone In Labor Force | Age 45-54 Correlation Chart
The statistical analysis conducted on geographies consisting of 172,534,936 people shows a poor negative correlation between the proportion of Immigrants from Bulgaria and labor force participation rate among population between the ages 45 and 54 in the United States with a correlation coefficient (R) of -0.163 and weighted average of 83.8%. Similarly, the statistical analysis conducted on geographies consisting of 101,646,283 people shows a mild negative correlation between the proportion of Immigrants from Sierra Leone and labor force participation rate among population between the ages 45 and 54 in the United States with a correlation coefficient (R) of -0.315 and weighted average of 84.4%, a difference of 0.71%.
In Labor Force | Age 45-54 Correlation Summary
| Measurement | Immigrants from Bulgaria | Immigrants from Sierra Leone |
| Minimum | 71.6% | 59.4% |
| Maximum | 92.9% | 100.0% |
| Range | 21.3% | 40.6% |
| Mean | 85.3% | 85.7% |
| Median | 85.9% | 85.9% |
| Interquartile 25% (IQ1) | 83.2% | 83.5% |
| Interquartile 75% (IQ3) | 88.7% | 88.9% |
| Interquartile Range (IQR) | 5.5% | 5.4% |
| Standard Deviation (Sample) | 4.7% | 5.7% |
| Standard Deviation (Population) | 4.6% | 5.6% |
Similar Demographics by In Labor Force | Age 45-54
Demographics Similar to Immigrants from Bulgaria by In Labor Force | Age 45-54
In terms of in labor force | age 45-54, the demographic groups most similar to Immigrants from Bulgaria are Immigrants from Eritrea (83.8%, a difference of 0.020%), Immigrants from Pakistan (83.8%, a difference of 0.030%), Immigrants from Lithuania (83.9%, a difference of 0.040%), Turkish (83.8%, a difference of 0.040%), and Latvian (83.8%, a difference of 0.040%).
| Demographics | Rating | Rank | In Labor Force | Age 45-54 |
| Tlingit-Haida | 99.8 /100 | #23 | Exceptional 83.9% |
| Slovenes | 99.8 /100 | #24 | Exceptional 83.9% |
| Immigrants | North Macedonia | 99.8 /100 | #25 | Exceptional 83.9% |
| Immigrants | Serbia | 99.8 /100 | #26 | Exceptional 83.9% |
| Immigrants | Brazil | 99.8 /100 | #27 | Exceptional 83.9% |
| Immigrants | Lithuania | 99.8 /100 | #28 | Exceptional 83.9% |
| Immigrants | Pakistan | 99.7 /100 | #29 | Exceptional 83.8% |
| Immigrants | Bulgaria | 99.7 /100 | #30 | Exceptional 83.8% |
| Immigrants | Eritrea | 99.7 /100 | #31 | Exceptional 83.8% |
| Turks | 99.7 /100 | #32 | Exceptional 83.8% |
| Latvians | 99.7 /100 | #33 | Exceptional 83.8% |
| Kenyans | 99.5 /100 | #34 | Exceptional 83.7% |
| Brazilians | 99.5 /100 | #35 | Exceptional 83.7% |
| Ugandans | 99.5 /100 | #36 | Exceptional 83.7% |
| Swedes | 99.4 /100 | #37 | Exceptional 83.7% |
Demographics Similar to Immigrants from Sierra Leone by In Labor Force | Age 45-54
In terms of in labor force | age 45-54, the demographic groups most similar to Immigrants from Sierra Leone are Norwegian (84.4%, a difference of 0.020%), Sierra Leonean (84.5%, a difference of 0.11%), Thai (84.3%, a difference of 0.11%), Immigrants from Cameroon (84.6%, a difference of 0.22%), and Bulgarian (84.2%, a difference of 0.22%).
| Demographics | Rating | Rank | In Labor Force | Age 45-54 |
| Luxembourgers | 100.0 /100 | #2 | Exceptional 85.0% |
| Bolivians | 100.0 /100 | #3 | Exceptional 84.9% |
| Immigrants | Ethiopia | 100.0 /100 | #4 | Exceptional 84.8% |
| Ethiopians | 100.0 /100 | #5 | Exceptional 84.8% |
| Immigrants | India | 100.0 /100 | #6 | Exceptional 84.7% |
| Immigrants | Cameroon | 100.0 /100 | #7 | Exceptional 84.6% |
| Sierra Leoneans | 100.0 /100 | #8 | Exceptional 84.5% |
| Immigrants | Sierra Leone | 100.0 /100 | #9 | Exceptional 84.4% |
| Norwegians | 100.0 /100 | #10 | Exceptional 84.4% |
| Thais | 100.0 /100 | #11 | Exceptional 84.3% |
| Bulgarians | 100.0 /100 | #12 | Exceptional 84.2% |
| Chinese | 99.9 /100 | #13 | Exceptional 84.1% |
| Cambodians | 99.9 /100 | #14 | Exceptional 84.1% |
| Cypriots | 99.9 /100 | #15 | Exceptional 84.1% |
| Immigrants | Nepal | 99.9 /100 | #16 | Exceptional 84.0% |