Asian vs Burmese Disability Age 35 to 64
COMPARE
Asian
Burmese
Disability Age 35 to 64
Disability Age 35 to 64 Comparison
Asians
Burmese
9.4%
DISABILITY AGE 35 TO 64
100.0/ 100
METRIC RATING
24th/ 347
METRIC RANK
9.2%
DISABILITY AGE 35 TO 64
100.0/ 100
METRIC RATING
17th/ 347
METRIC RANK
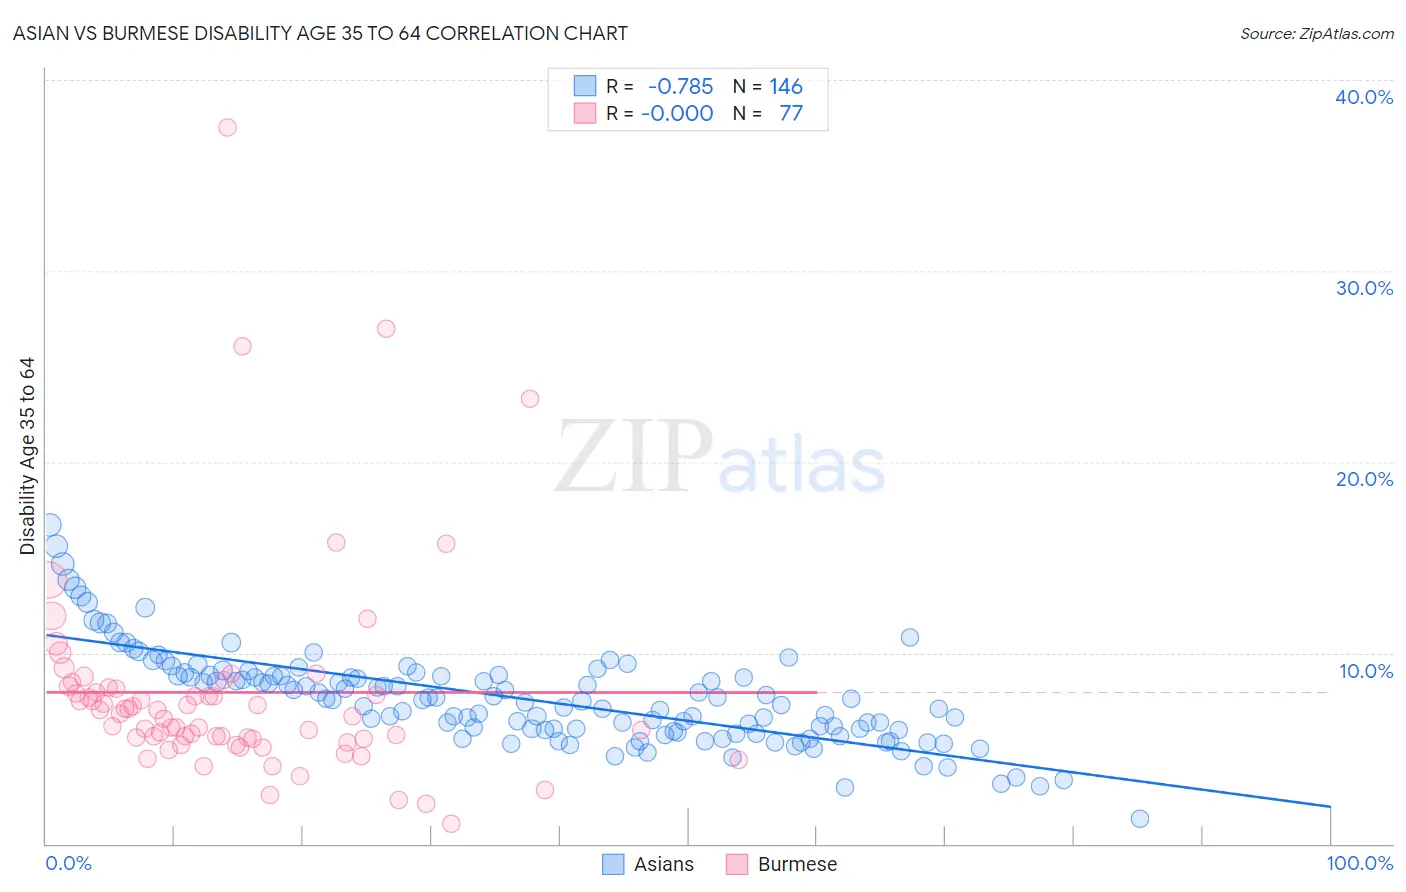
Asian vs Burmese Disability Age 35 to 64 Correlation Chart
The statistical analysis conducted on geographies consisting of 549,994,664 people shows a strong negative correlation between the proportion of Asians and percentage of population with a disability between the ages 34 and 64 in the United States with a correlation coefficient (R) of -0.785 and weighted average of 9.4%. Similarly, the statistical analysis conducted on geographies consisting of 464,803,120 people shows no correlation between the proportion of Burmese and percentage of population with a disability between the ages 34 and 64 in the United States with a correlation coefficient (R) of -0.000 and weighted average of 9.2%, a difference of 1.9%.
Disability Age 35 to 64 Correlation Summary
| Measurement | Asian | Burmese |
| Minimum | 1.3% | 1.0% |
| Maximum | 16.7% | 37.5% |
| Range | 15.4% | 36.5% |
| Mean | 7.6% | 7.9% |
| Median | 7.5% | 6.8% |
| Interquartile 25% (IQ1) | 5.9% | 5.5% |
| Interquartile 75% (IQ3) | 8.8% | 8.2% |
| Interquartile Range (IQR) | 2.9% | 2.6% |
| Standard Deviation (Sample) | 2.5% | 5.6% |
| Standard Deviation (Population) | 2.5% | 5.6% |
Demographics Similar to Asians and Burmese by Disability Age 35 to 64
In terms of disability age 35 to 64, the demographic groups most similar to Asians are Argentinean (9.4%, a difference of 0.010%), Cypriot (9.4%, a difference of 0.23%), Okinawan (9.4%, a difference of 0.26%), Venezuelan (9.4%, a difference of 0.29%), and Immigrants from Argentina (9.3%, a difference of 0.69%). Similarly, the demographic groups most similar to Burmese are Soviet Union (9.2%, a difference of 0.41%), Immigrants from Venezuela (9.3%, a difference of 0.65%), Immigrants from Argentina (9.3%, a difference of 1.2%), Okinawan (9.4%, a difference of 1.6%), and Cypriot (9.4%, a difference of 1.6%).
| Demographics | Rating | Rank | Disability Age 35 to 64 |
| Immigrants | Bolivia | 100.0 /100 | #10 | Exceptional 8.7% |
| Immigrants | Eastern Asia | 100.0 /100 | #11 | Exceptional 8.8% |
| Indians (Asian) | 100.0 /100 | #12 | Exceptional 8.9% |
| Immigrants | South Central Asia | 100.0 /100 | #13 | Exceptional 8.9% |
| Immigrants | Singapore | 100.0 /100 | #14 | Exceptional 8.9% |
| Bolivians | 100.0 /100 | #15 | Exceptional 8.9% |
| Immigrants | Korea | 100.0 /100 | #16 | Exceptional 9.0% |
| Burmese | 100.0 /100 | #17 | Exceptional 9.2% |
| Soviet Union | 100.0 /100 | #18 | Exceptional 9.2% |
| Immigrants | Venezuela | 100.0 /100 | #19 | Exceptional 9.3% |
| Immigrants | Argentina | 100.0 /100 | #20 | Exceptional 9.3% |
| Okinawans | 100.0 /100 | #21 | Exceptional 9.4% |
| Cypriots | 100.0 /100 | #22 | Exceptional 9.4% |
| Argentineans | 100.0 /100 | #23 | Exceptional 9.4% |
| Asians | 100.0 /100 | #24 | Exceptional 9.4% |
| Venezuelans | 100.0 /100 | #25 | Exceptional 9.4% |
| Immigrants | Sri Lanka | 100.0 /100 | #26 | Exceptional 9.5% |
| Immigrants | Asia | 100.0 /100 | #27 | Exceptional 9.5% |
| Immigrants | Pakistan | 100.0 /100 | #28 | Exceptional 9.5% |
| Immigrants | Ireland | 100.0 /100 | #29 | Exceptional 9.5% |
| Immigrants | Japan | 100.0 /100 | #30 | Exceptional 9.5% |