Immigrants from Bulgaria vs Burmese Unemployment Among Ages 16 to 19 years
COMPARE
Immigrants from Bulgaria
Burmese
Unemployment Among Ages 16 to 19 years
Unemployment Among Ages 16 to 19 years Comparison
Immigrants from Bulgaria
Burmese
17.0%
UNEMPLOYMENT AMONG AGES 16 TO 19 YEARS
94.3/ 100
METRIC RATING
105th/ 347
METRIC RANK
17.0%
UNEMPLOYMENT AMONG AGES 16 TO 19 YEARS
95.0/ 100
METRIC RATING
98th/ 347
METRIC RANK
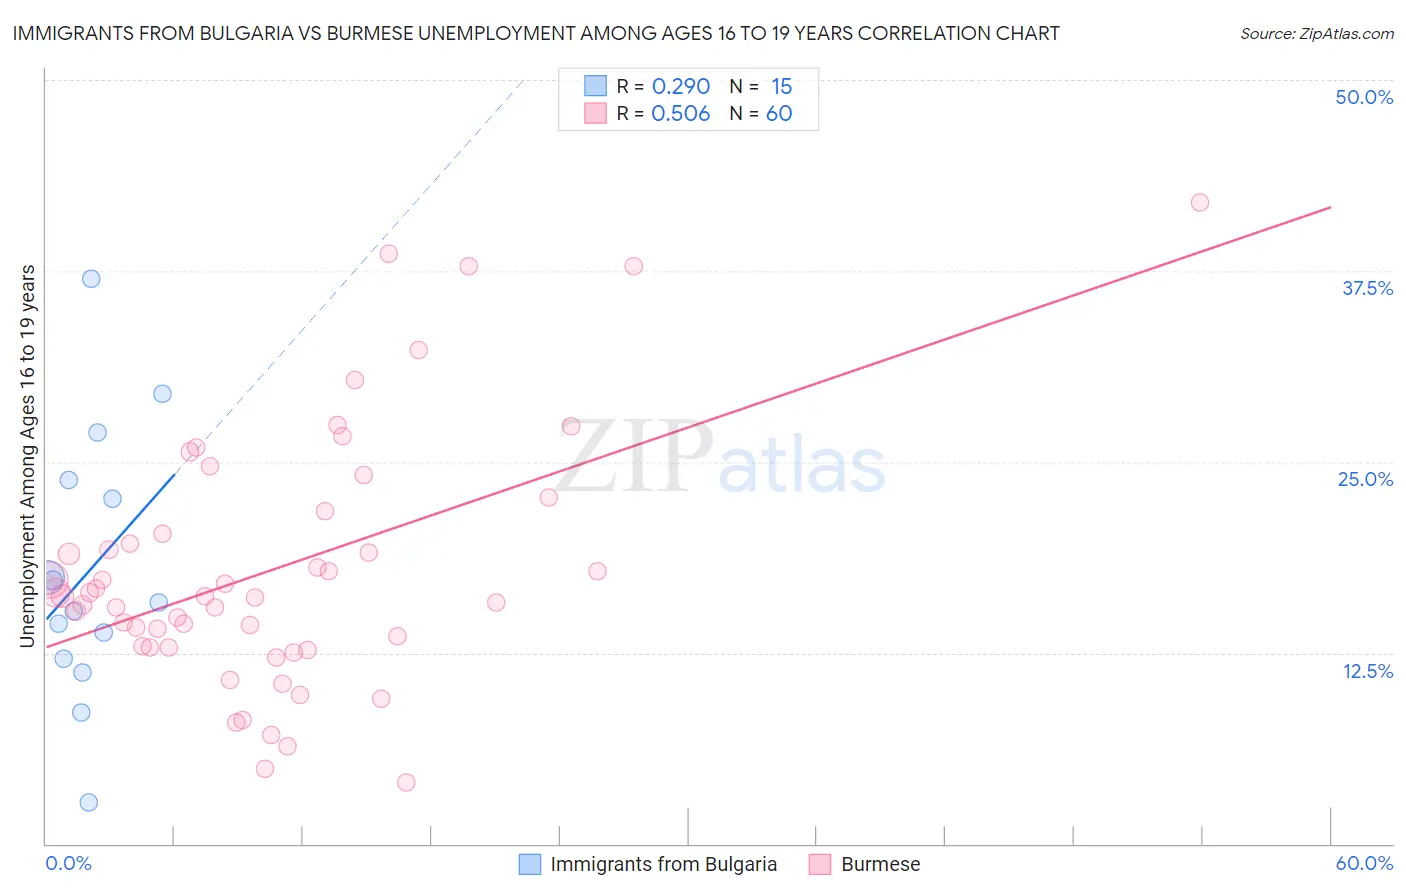
Immigrants from Bulgaria vs Burmese Unemployment Among Ages 16 to 19 years Correlation Chart
The statistical analysis conducted on geographies consisting of 167,838,328 people shows a weak positive correlation between the proportion of Immigrants from Bulgaria and unemployment rate among population between the ages 16 and 19 in the United States with a correlation coefficient (R) of 0.290 and weighted average of 17.0%. Similarly, the statistical analysis conducted on geographies consisting of 436,604,965 people shows a substantial positive correlation between the proportion of Burmese and unemployment rate among population between the ages 16 and 19 in the United States with a correlation coefficient (R) of 0.506 and weighted average of 17.0%, a difference of 0.15%.
Unemployment Among Ages 16 to 19 years Correlation Summary
| Measurement | Immigrants from Bulgaria | Burmese |
| Minimum | 2.7% | 4.0% |
| Maximum | 37.0% | 42.0% |
| Range | 34.3% | 38.0% |
| Mean | 17.9% | 18.0% |
| Median | 15.8% | 16.2% |
| Interquartile 25% (IQ1) | 12.1% | 12.9% |
| Interquartile 75% (IQ3) | 23.8% | 21.0% |
| Interquartile Range (IQR) | 11.7% | 8.1% |
| Standard Deviation (Sample) | 8.8% | 8.3% |
| Standard Deviation (Population) | 8.5% | 8.2% |
Demographics Similar to Immigrants from Bulgaria and Burmese by Unemployment Among Ages 16 to 19 years
In terms of unemployment among ages 16 to 19 years, the demographic groups most similar to Immigrants from Bulgaria are Estonian (17.0%, a difference of 0.0%), Immigrants from Brazil (17.0%, a difference of 0.030%), Malaysian (17.0%, a difference of 0.030%), Palestinian (17.0%, a difference of 0.050%), and Italian (17.0%, a difference of 0.050%). Similarly, the demographic groups most similar to Burmese are Immigrants from Lithuania (17.0%, a difference of 0.020%), Immigrants from Thailand (17.0%, a difference of 0.060%), Immigrants from Saudi Arabia (17.0%, a difference of 0.070%), Immigrants from Pakistan (17.0%, a difference of 0.090%), and Immigrants from Venezuela (16.9%, a difference of 0.10%).
| Demographics | Rating | Rank | Unemployment Among Ages 16 to 19 years |
| Cambodians | 96.3 /100 | #91 | Exceptional 16.9% |
| South Africans | 95.9 /100 | #92 | Exceptional 16.9% |
| Cubans | 95.8 /100 | #93 | Exceptional 16.9% |
| Bangladeshis | 95.8 /100 | #94 | Exceptional 16.9% |
| Mongolians | 95.6 /100 | #95 | Exceptional 16.9% |
| Ottawa | 95.4 /100 | #96 | Exceptional 16.9% |
| Immigrants | Venezuela | 95.3 /100 | #97 | Exceptional 16.9% |
| Burmese | 95.0 /100 | #98 | Exceptional 17.0% |
| Immigrants | Lithuania | 94.9 /100 | #99 | Exceptional 17.0% |
| Immigrants | Thailand | 94.7 /100 | #100 | Exceptional 17.0% |
| Immigrants | Saudi Arabia | 94.7 /100 | #101 | Exceptional 17.0% |
| Immigrants | Pakistan | 94.6 /100 | #102 | Exceptional 17.0% |
| Palestinians | 94.6 /100 | #103 | Exceptional 17.0% |
| Italians | 94.5 /100 | #104 | Exceptional 17.0% |
| Immigrants | Bulgaria | 94.3 /100 | #105 | Exceptional 17.0% |
| Estonians | 94.3 /100 | #106 | Exceptional 17.0% |
| Immigrants | Brazil | 94.2 /100 | #107 | Exceptional 17.0% |
| Malaysians | 94.2 /100 | #108 | Exceptional 17.0% |
| Iranians | 94.1 /100 | #109 | Exceptional 17.0% |
| Immigrants | Netherlands | 93.9 /100 | #110 | Exceptional 17.0% |
| Immigrants | Asia | 93.9 /100 | #111 | Exceptional 17.0% |