Immigrants from Bolivia vs Immigrants from India Median Household Income
COMPARE
Immigrants from Bolivia
Immigrants from India
Median Household Income
Median Household Income Comparison
Immigrants from Bolivia
Immigrants from India
$101,394
MEDIAN HOUSEHOLD INCOME
100.0/ 100
METRIC RATING
23rd/ 347
METRIC RANK
$113,009
MEDIAN HOUSEHOLD INCOME
100.0/ 100
METRIC RATING
3rd/ 347
METRIC RANK
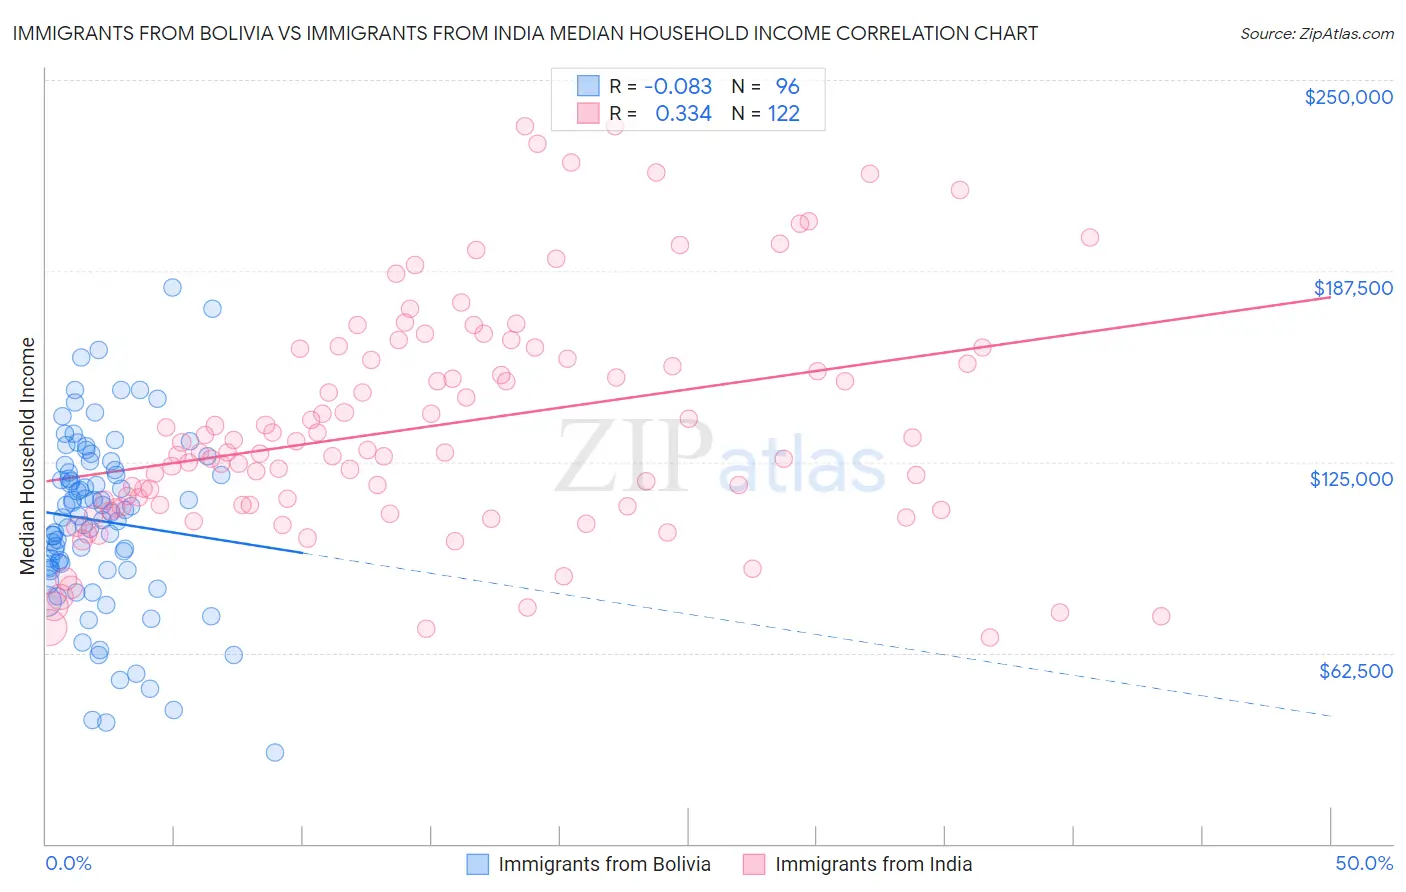
Immigrants from Bolivia vs Immigrants from India Median Household Income Correlation Chart
The statistical analysis conducted on geographies consisting of 158,713,567 people shows a slight negative correlation between the proportion of Immigrants from Bolivia and median household income in the United States with a correlation coefficient (R) of -0.083 and weighted average of $101,394. Similarly, the statistical analysis conducted on geographies consisting of 433,644,009 people shows a mild positive correlation between the proportion of Immigrants from India and median household income in the United States with a correlation coefficient (R) of 0.334 and weighted average of $113,009, a difference of 11.5%.
Median Household Income Correlation Summary
| Measurement | Immigrants from Bolivia | Immigrants from India |
| Minimum | $29,844 | $67,645 |
| Maximum | $182,250 | $235,000 |
| Range | $152,406 | $167,355 |
| Mean | $105,682 | $136,655 |
| Median | $107,900 | $128,100 |
| Interquartile 25% (IQ1) | $89,971 | $110,458 |
| Interquartile 75% (IQ3) | $123,106 | $158,899 |
| Interquartile Range (IQR) | $33,135 | $48,441 |
| Standard Deviation (Sample) | $29,190 | $37,841 |
| Standard Deviation (Population) | $29,037 | $37,686 |
Demographics Similar to Immigrants from Bolivia and Immigrants from India by Median Household Income
In terms of median household income, the demographic groups most similar to Immigrants from Bolivia are Asian ($101,681, a difference of 0.28%), Eastern European ($101,781, a difference of 0.38%), Bolivian ($102,195, a difference of 0.79%), Immigrants from Australia ($102,562, a difference of 1.1%), and Cypriot ($102,843, a difference of 1.4%). Similarly, the demographic groups most similar to Immigrants from India are Immigrants from Hong Kong ($111,519, a difference of 1.3%), Thai ($110,648, a difference of 2.1%), Immigrants from Singapore ($110,428, a difference of 2.3%), Iranian ($109,835, a difference of 2.9%), and Immigrants from Iran ($108,055, a difference of 4.6%).
| Demographics | Rating | Rank | Median Household Income |
| Immigrants | India | 100.0 /100 | #3 | Exceptional $113,009 |
| Immigrants | Hong Kong | 100.0 /100 | #4 | Exceptional $111,519 |
| Thais | 100.0 /100 | #5 | Exceptional $110,648 |
| Immigrants | Singapore | 100.0 /100 | #6 | Exceptional $110,428 |
| Iranians | 100.0 /100 | #7 | Exceptional $109,835 |
| Immigrants | Iran | 100.0 /100 | #8 | Exceptional $108,055 |
| Okinawans | 100.0 /100 | #9 | Exceptional $106,624 |
| Immigrants | South Central Asia | 100.0 /100 | #10 | Exceptional $106,057 |
| Immigrants | China | 100.0 /100 | #11 | Exceptional $105,335 |
| Indians (Asian) | 100.0 /100 | #12 | Exceptional $105,262 |
| Immigrants | Eastern Asia | 100.0 /100 | #13 | Exceptional $104,796 |
| Immigrants | Ireland | 100.0 /100 | #14 | Exceptional $104,692 |
| Immigrants | Israel | 100.0 /100 | #15 | Exceptional $104,090 |
| Burmese | 100.0 /100 | #16 | Exceptional $103,145 |
| Immigrants | Korea | 100.0 /100 | #17 | Exceptional $102,962 |
| Cypriots | 100.0 /100 | #18 | Exceptional $102,843 |
| Immigrants | Australia | 100.0 /100 | #19 | Exceptional $102,562 |
| Bolivians | 100.0 /100 | #20 | Exceptional $102,195 |
| Eastern Europeans | 100.0 /100 | #21 | Exceptional $101,781 |
| Asians | 100.0 /100 | #22 | Exceptional $101,681 |
| Immigrants | Bolivia | 100.0 /100 | #23 | Exceptional $101,394 |