Immigrants from Belgium vs Icelander Vision Disability
COMPARE
Immigrants from Belgium
Icelander
Vision Disability
Vision Disability Comparison
Immigrants from Belgium
Icelanders
2.0%
VISION DISABILITY
99.1/ 100
METRIC RATING
61st/ 347
METRIC RANK
2.1%
VISION DISABILITY
66.1/ 100
METRIC RATING
163rd/ 347
METRIC RANK
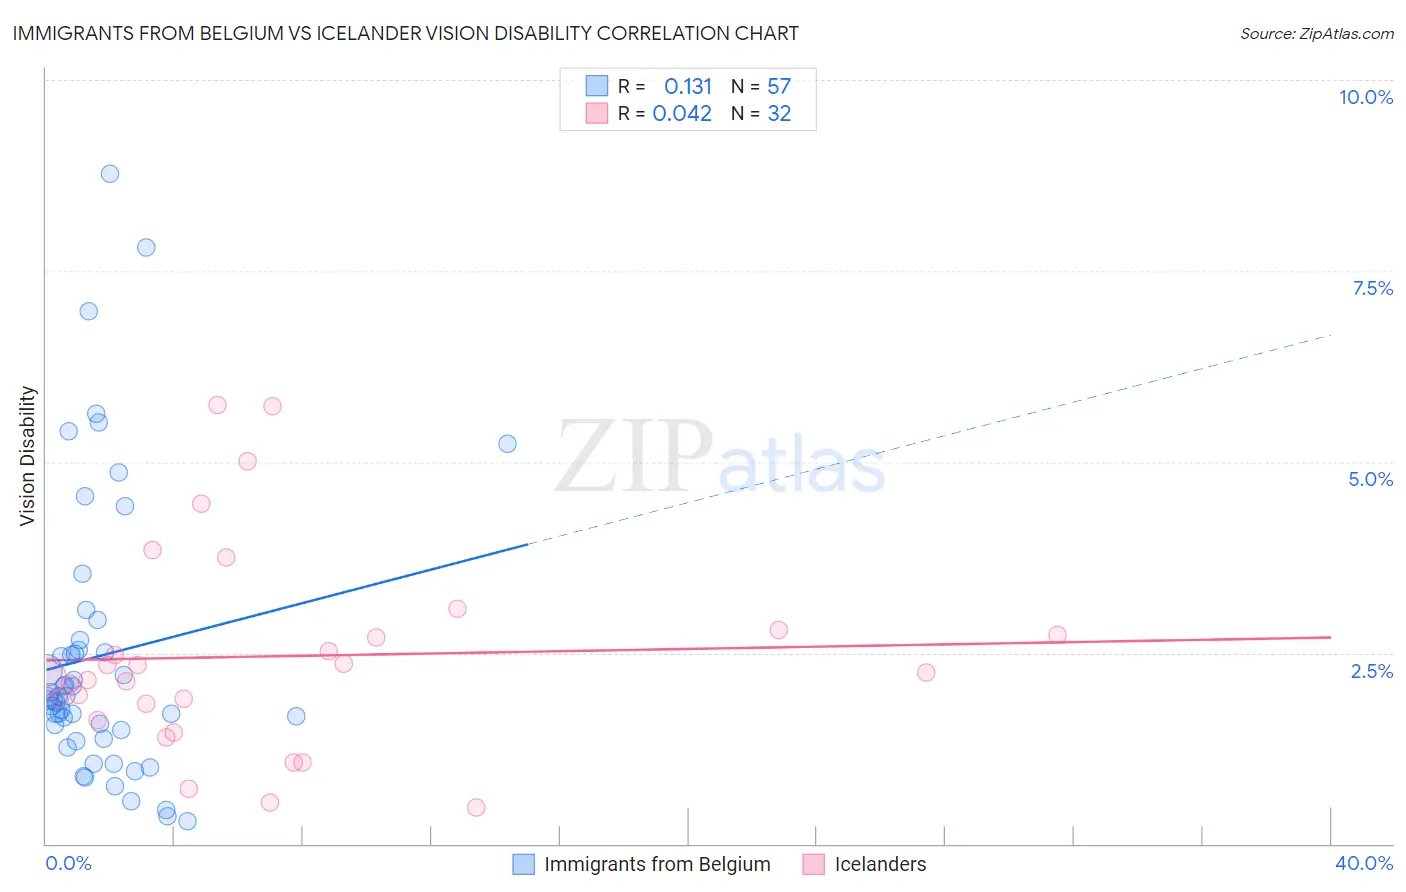
Immigrants from Belgium vs Icelander Vision Disability Correlation Chart
The statistical analysis conducted on geographies consisting of 146,674,933 people shows a poor positive correlation between the proportion of Immigrants from Belgium and percentage of population with vision disability in the United States with a correlation coefficient (R) of 0.131 and weighted average of 2.0%. Similarly, the statistical analysis conducted on geographies consisting of 159,612,613 people shows no correlation between the proportion of Icelanders and percentage of population with vision disability in the United States with a correlation coefficient (R) of 0.042 and weighted average of 2.1%, a difference of 6.9%.
Vision Disability Correlation Summary
| Measurement | Immigrants from Belgium | Icelander |
| Minimum | 0.30% | 0.48% |
| Maximum | 8.8% | 5.7% |
| Range | 8.5% | 5.3% |
| Mean | 2.5% | 2.5% |
| Median | 1.9% | 2.2% |
| Interquartile 25% (IQ1) | 1.4% | 1.7% |
| Interquartile 75% (IQ3) | 2.6% | 2.8% |
| Interquartile Range (IQR) | 1.2% | 1.0% |
| Standard Deviation (Sample) | 1.8% | 1.3% |
| Standard Deviation (Population) | 1.8% | 1.3% |
Similar Demographics by Vision Disability
Demographics Similar to Immigrants from Belgium by Vision Disability
In terms of vision disability, the demographic groups most similar to Immigrants from Belgium are Immigrants from Romania (2.0%, a difference of 0.010%), Immigrants from Russia (2.0%, a difference of 0.020%), Argentinean (2.0%, a difference of 0.040%), Armenian (2.0%, a difference of 0.13%), and Immigrants from Saudi Arabia (2.0%, a difference of 0.18%).
| Demographics | Rating | Rank | Vision Disability |
| Macedonians | 99.3 /100 | #54 | Exceptional 2.0% |
| Laotians | 99.3 /100 | #55 | Exceptional 2.0% |
| Jordanians | 99.2 /100 | #56 | Exceptional 2.0% |
| Somalis | 99.2 /100 | #57 | Exceptional 2.0% |
| Immigrants | Saudi Arabia | 99.2 /100 | #58 | Exceptional 2.0% |
| Argentineans | 99.1 /100 | #59 | Exceptional 2.0% |
| Immigrants | Romania | 99.1 /100 | #60 | Exceptional 2.0% |
| Immigrants | Belgium | 99.1 /100 | #61 | Exceptional 2.0% |
| Immigrants | Russia | 99.1 /100 | #62 | Exceptional 2.0% |
| Armenians | 99.0 /100 | #63 | Exceptional 2.0% |
| Immigrants | Greece | 99.0 /100 | #64 | Exceptional 2.0% |
| Maltese | 98.9 /100 | #65 | Exceptional 2.0% |
| Immigrants | Argentina | 98.9 /100 | #66 | Exceptional 2.0% |
| Immigrants | Northern Africa | 98.8 /100 | #67 | Exceptional 2.0% |
| Immigrants | Czechoslovakia | 98.7 /100 | #68 | Exceptional 2.0% |
Demographics Similar to Icelanders by Vision Disability
In terms of vision disability, the demographic groups most similar to Icelanders are Immigrants from Bangladesh (2.1%, a difference of 0.040%), Hungarian (2.1%, a difference of 0.090%), Immigrants from Iraq (2.1%, a difference of 0.090%), Iraqi (2.1%, a difference of 0.12%), and Austrian (2.1%, a difference of 0.21%).
| Demographics | Rating | Rank | Vision Disability |
| Pakistanis | 71.6 /100 | #156 | Good 2.1% |
| Serbians | 70.2 /100 | #157 | Good 2.1% |
| Immigrants | Uzbekistan | 69.9 /100 | #158 | Good 2.1% |
| South Africans | 69.8 /100 | #159 | Good 2.1% |
| Austrians | 69.0 /100 | #160 | Good 2.1% |
| Iraqis | 67.7 /100 | #161 | Good 2.1% |
| Hungarians | 67.4 /100 | #162 | Good 2.1% |
| Icelanders | 66.1 /100 | #163 | Good 2.1% |
| Immigrants | Bangladesh | 65.5 /100 | #164 | Good 2.1% |
| Immigrants | Iraq | 64.8 /100 | #165 | Good 2.1% |
| Immigrants | England | 62.8 /100 | #166 | Good 2.1% |
| Immigrants | Africa | 62.6 /100 | #167 | Good 2.1% |
| Brazilians | 62.2 /100 | #168 | Good 2.1% |
| South American Indians | 57.4 /100 | #169 | Average 2.2% |
| Swiss | 55.7 /100 | #170 | Average 2.2% |