Immigrants from Belarus vs Immigrants from Cuba Kindergarten
COMPARE
Immigrants from Belarus
Immigrants from Cuba
Kindergarten
Kindergarten Comparison
Immigrants from Belarus
Immigrants from Cuba
97.9%
KINDERGARTEN
39.4/ 100
METRIC RATING
185th/ 347
METRIC RANK
97.1%
KINDERGARTEN
0.0/ 100
METRIC RATING
299th/ 347
METRIC RANK
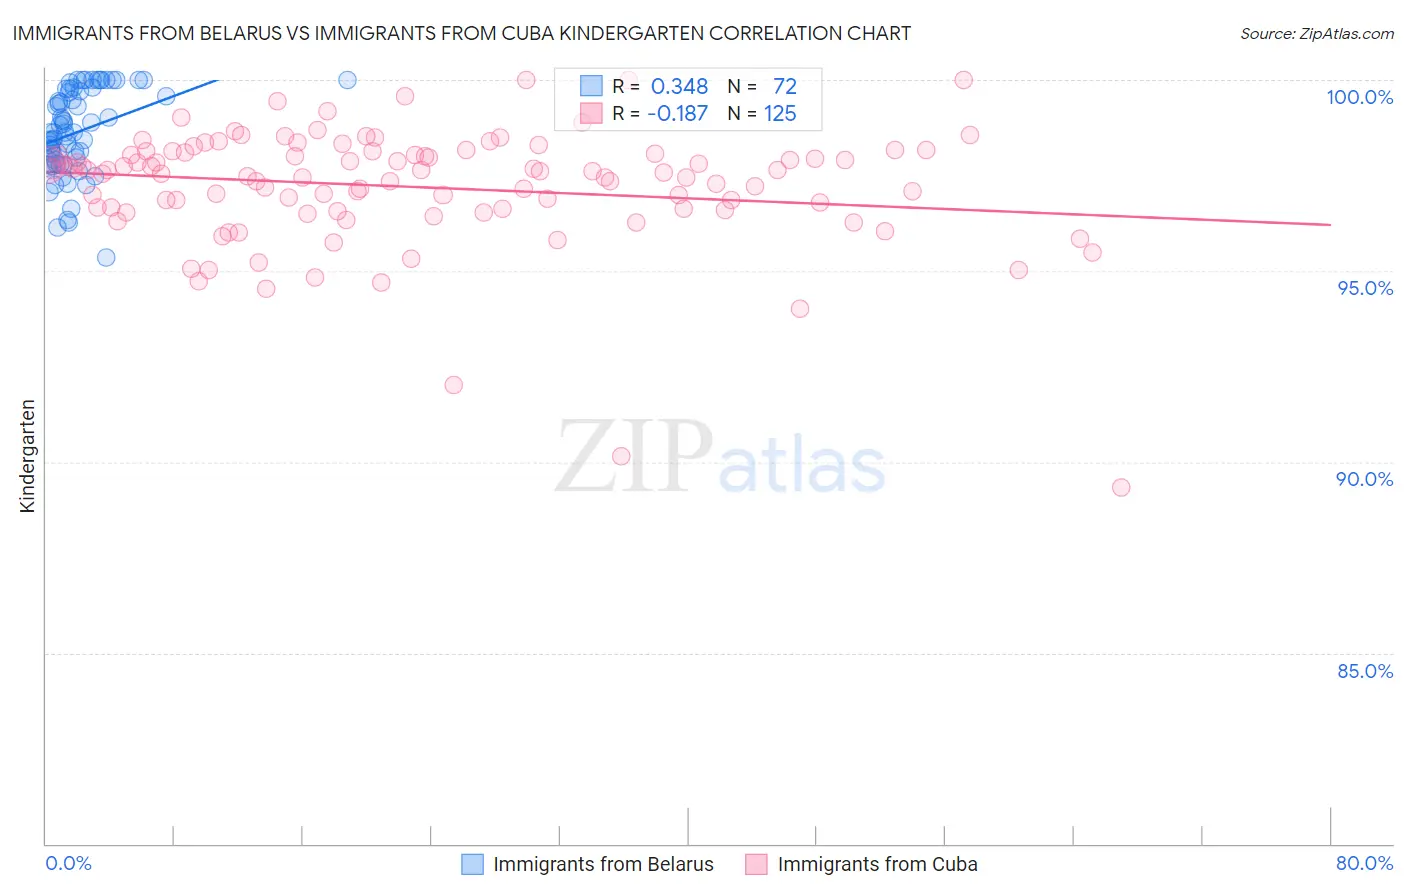
Immigrants from Belarus vs Immigrants from Cuba Kindergarten Correlation Chart
The statistical analysis conducted on geographies consisting of 149,993,317 people shows a mild positive correlation between the proportion of Immigrants from Belarus and percentage of population with at least kindergarten education in the United States with a correlation coefficient (R) of 0.348 and weighted average of 97.9%. Similarly, the statistical analysis conducted on geographies consisting of 326,028,159 people shows a poor negative correlation between the proportion of Immigrants from Cuba and percentage of population with at least kindergarten education in the United States with a correlation coefficient (R) of -0.187 and weighted average of 97.1%, a difference of 0.81%.
Kindergarten Correlation Summary
| Measurement | Immigrants from Belarus | Immigrants from Cuba |
| Minimum | 95.4% | 89.3% |
| Maximum | 100.0% | 100.0% |
| Range | 4.6% | 10.7% |
| Mean | 98.6% | 97.2% |
| Median | 98.6% | 97.6% |
| Interquartile 25% (IQ1) | 97.9% | 96.6% |
| Interquartile 75% (IQ3) | 99.7% | 98.1% |
| Interquartile Range (IQR) | 1.9% | 1.5% |
| Standard Deviation (Sample) | 1.1% | 1.6% |
| Standard Deviation (Population) | 1.1% | 1.6% |
Similar Demographics by Kindergarten
Demographics Similar to Immigrants from Belarus by Kindergarten
In terms of kindergarten, the demographic groups most similar to Immigrants from Belarus are Immigrants from Argentina (97.9%, a difference of 0.0%), Portuguese (97.9%, a difference of 0.010%), Egyptian (97.9%, a difference of 0.010%), Immigrants from Poland (97.9%, a difference of 0.010%), and Pakistani (97.9%, a difference of 0.010%).
| Demographics | Rating | Rank | Kindergarten |
| Brazilians | 47.6 /100 | #178 | Average 97.9% |
| Argentineans | 46.8 /100 | #179 | Average 97.9% |
| Immigrants | Bosnia and Herzegovina | 46.7 /100 | #180 | Average 97.9% |
| Portuguese | 43.5 /100 | #181 | Average 97.9% |
| Egyptians | 42.4 /100 | #182 | Average 97.9% |
| Immigrants | Poland | 41.4 /100 | #183 | Average 97.9% |
| Immigrants | Argentina | 40.7 /100 | #184 | Average 97.9% |
| Immigrants | Belarus | 39.4 /100 | #185 | Fair 97.9% |
| Pakistanis | 36.0 /100 | #186 | Fair 97.9% |
| Immigrants | Kazakhstan | 35.9 /100 | #187 | Fair 97.9% |
| Arabs | 35.4 /100 | #188 | Fair 97.9% |
| Paiute | 34.7 /100 | #189 | Fair 97.9% |
| Panamanians | 33.3 /100 | #190 | Fair 97.9% |
| Immigrants | Taiwan | 30.7 /100 | #191 | Fair 97.9% |
| Blacks/African Americans | 29.9 /100 | #192 | Fair 97.9% |
Demographics Similar to Immigrants from Cuba by Kindergarten
In terms of kindergarten, the demographic groups most similar to Immigrants from Cuba are Immigrants from Dominica (97.1%, a difference of 0.010%), Haitian (97.1%, a difference of 0.010%), Central American Indian (97.2%, a difference of 0.030%), Immigrants from South Eastern Asia (97.1%, a difference of 0.030%), and Immigrants from Caribbean (97.1%, a difference of 0.060%).
| Demographics | Rating | Rank | Kindergarten |
| British West Indians | 0.0 /100 | #292 | Tragic 97.3% |
| Malaysians | 0.0 /100 | #293 | Tragic 97.2% |
| Immigrants | Immigrants | 0.0 /100 | #294 | Tragic 97.2% |
| Immigrants | Grenada | 0.0 /100 | #295 | Tragic 97.2% |
| Immigrants | Eritrea | 0.0 /100 | #296 | Tragic 97.2% |
| Central American Indians | 0.0 /100 | #297 | Tragic 97.2% |
| Immigrants | Dominica | 0.0 /100 | #298 | Tragic 97.1% |
| Immigrants | Cuba | 0.0 /100 | #299 | Tragic 97.1% |
| Haitians | 0.0 /100 | #300 | Tragic 97.1% |
| Immigrants | South Eastern Asia | 0.0 /100 | #301 | Tragic 97.1% |
| Immigrants | Caribbean | 0.0 /100 | #302 | Tragic 97.1% |
| Somalis | 0.0 /100 | #303 | Tragic 97.0% |
| Nicaraguans | 0.0 /100 | #304 | Tragic 97.0% |
| Ecuadorians | 0.0 /100 | #305 | Tragic 97.0% |
| Belizeans | 0.0 /100 | #306 | Tragic 97.0% |