Lebanese vs Immigrants from Cuba Disability Age Under 5
COMPARE
Lebanese
Immigrants from Cuba
Disability Age Under 5
Disability Age Under 5 Comparison
Lebanese
Immigrants from Cuba
1.3%
DISABILITY AGE UNDER 5
5.3/ 100
METRIC RATING
230th/ 347
METRIC RANK
1.1%
DISABILITY AGE UNDER 5
97.0/ 100
METRIC RATING
92nd/ 347
METRIC RANK
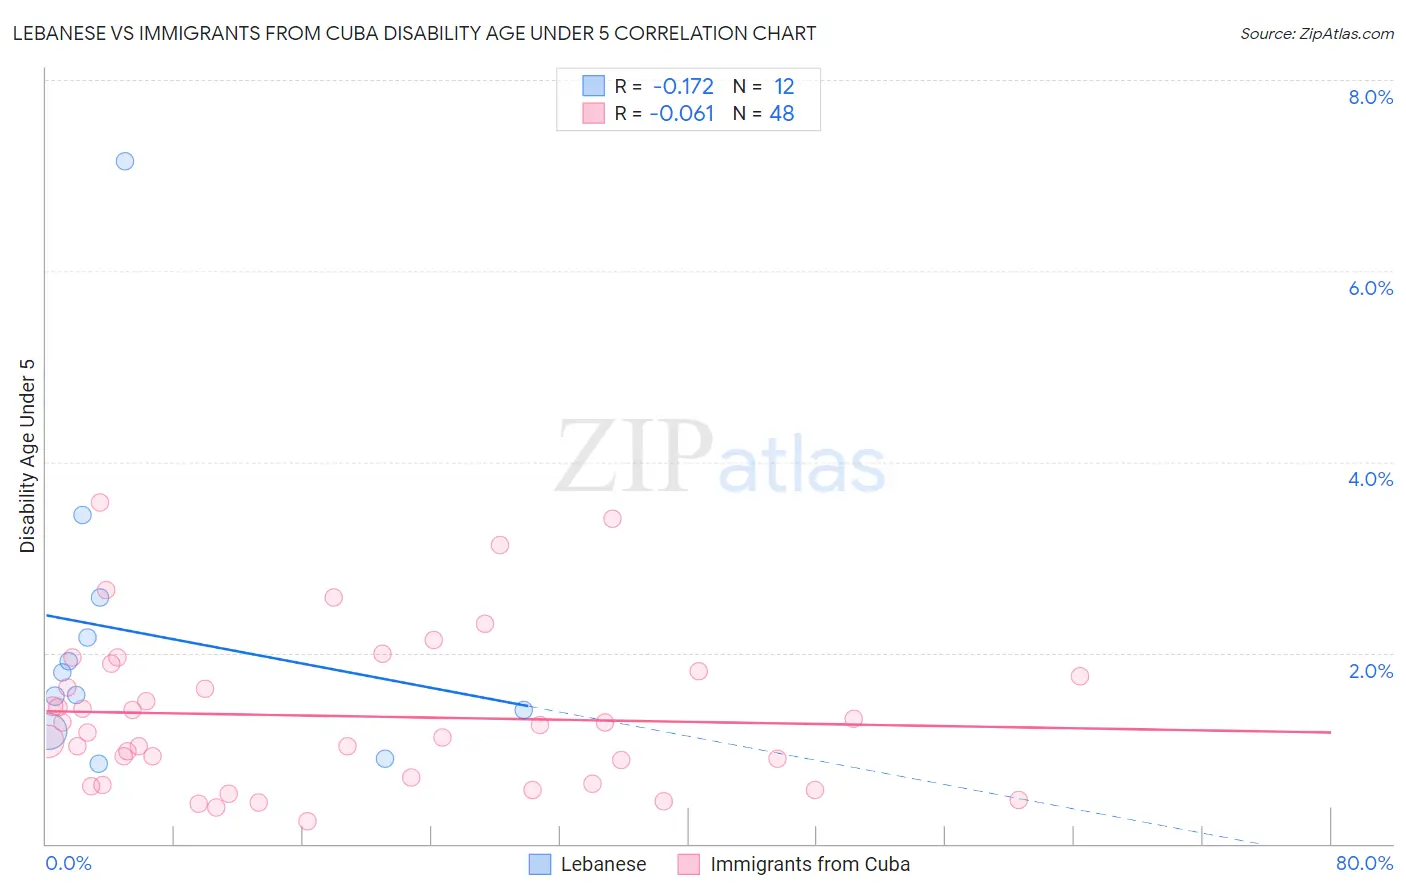
Lebanese vs Immigrants from Cuba Disability Age Under 5 Correlation Chart
The statistical analysis conducted on geographies consisting of 215,601,141 people shows a poor negative correlation between the proportion of Lebanese and percentage of population with a disability under the age of 5 in the United States with a correlation coefficient (R) of -0.172 and weighted average of 1.3%. Similarly, the statistical analysis conducted on geographies consisting of 186,893,063 people shows a slight negative correlation between the proportion of Immigrants from Cuba and percentage of population with a disability under the age of 5 in the United States with a correlation coefficient (R) of -0.061 and weighted average of 1.1%, a difference of 15.6%.
Disability Age Under 5 Correlation Summary
| Measurement | Lebanese | Immigrants from Cuba |
| Minimum | 0.84% | 0.24% |
| Maximum | 7.1% | 3.6% |
| Range | 6.3% | 3.3% |
| Mean | 2.2% | 1.3% |
| Median | 1.7% | 1.2% |
| Interquartile 25% (IQ1) | 1.3% | 0.66% |
| Interquartile 75% (IQ3) | 2.4% | 1.8% |
| Interquartile Range (IQR) | 1.1% | 1.1% |
| Standard Deviation (Sample) | 1.7% | 0.80% |
| Standard Deviation (Population) | 1.6% | 0.79% |
Similar Demographics by Disability Age Under 5
Demographics Similar to Lebanese by Disability Age Under 5
In terms of disability age under 5, the demographic groups most similar to Lebanese are Immigrants from Costa Rica (1.3%, a difference of 0.10%), Immigrants from Northern Europe (1.3%, a difference of 0.25%), Luxembourger (1.3%, a difference of 0.31%), Taiwanese (1.3%, a difference of 0.32%), and French American Indian (1.3%, a difference of 0.38%).
| Demographics | Rating | Rank | Disability Age Under 5 |
| Hispanics or Latinos | 7.7 /100 | #223 | Tragic 1.3% |
| Latvians | 7.1 /100 | #224 | Tragic 1.3% |
| Panamanians | 7.1 /100 | #225 | Tragic 1.3% |
| Bahamians | 7.1 /100 | #226 | Tragic 1.3% |
| Taiwanese | 6.1 /100 | #227 | Tragic 1.3% |
| Luxembourgers | 6.1 /100 | #228 | Tragic 1.3% |
| Immigrants | Costa Rica | 5.5 /100 | #229 | Tragic 1.3% |
| Lebanese | 5.3 /100 | #230 | Tragic 1.3% |
| Immigrants | Northern Europe | 4.7 /100 | #231 | Tragic 1.3% |
| French American Indians | 4.5 /100 | #232 | Tragic 1.3% |
| Tongans | 4.2 /100 | #233 | Tragic 1.3% |
| Pueblo | 3.8 /100 | #234 | Tragic 1.3% |
| Central American Indians | 3.6 /100 | #235 | Tragic 1.3% |
| South American Indians | 3.3 /100 | #236 | Tragic 1.3% |
| Basques | 3.0 /100 | #237 | Tragic 1.3% |
Demographics Similar to Immigrants from Cuba by Disability Age Under 5
In terms of disability age under 5, the demographic groups most similar to Immigrants from Cuba are Spanish American (1.1%, a difference of 0.030%), Sri Lankan (1.1%, a difference of 0.090%), Immigrants from Moldova (1.1%, a difference of 0.14%), Albanian (1.1%, a difference of 0.17%), and Chinese (1.1%, a difference of 0.21%).
| Demographics | Rating | Rank | Disability Age Under 5 |
| Sudanese | 97.7 /100 | #85 | Exceptional 1.1% |
| Okinawans | 97.6 /100 | #86 | Exceptional 1.1% |
| Ugandans | 97.5 /100 | #87 | Exceptional 1.1% |
| Immigrants | Dominican Republic | 97.5 /100 | #88 | Exceptional 1.1% |
| Ethiopians | 97.2 /100 | #89 | Exceptional 1.1% |
| Chinese | 97.2 /100 | #90 | Exceptional 1.1% |
| Albanians | 97.2 /100 | #91 | Exceptional 1.1% |
| Immigrants | Cuba | 97.0 /100 | #92 | Exceptional 1.1% |
| Spanish Americans | 96.9 /100 | #93 | Exceptional 1.1% |
| Sri Lankans | 96.8 /100 | #94 | Exceptional 1.1% |
| Immigrants | Moldova | 96.8 /100 | #95 | Exceptional 1.1% |
| Mongolians | 96.6 /100 | #96 | Exceptional 1.1% |
| Immigrants | Iraq | 96.5 /100 | #97 | Exceptional 1.1% |
| Immigrants | South Eastern Asia | 96.5 /100 | #98 | Exceptional 1.1% |
| Dominicans | 96.3 /100 | #99 | Exceptional 1.1% |