Immigrants from Bangladesh vs Immigrants from Singapore Currently Married
COMPARE
Immigrants from Bangladesh
Immigrants from Singapore
Currently Married
Currently Married Comparison
Immigrants from Bangladesh
Immigrants from Singapore
43.6%
CURRENTLY MARRIED
0.1/ 100
METRIC RATING
265th/ 347
METRIC RANK
47.8%
CURRENTLY MARRIED
93.3/ 100
METRIC RATING
105th/ 347
METRIC RANK
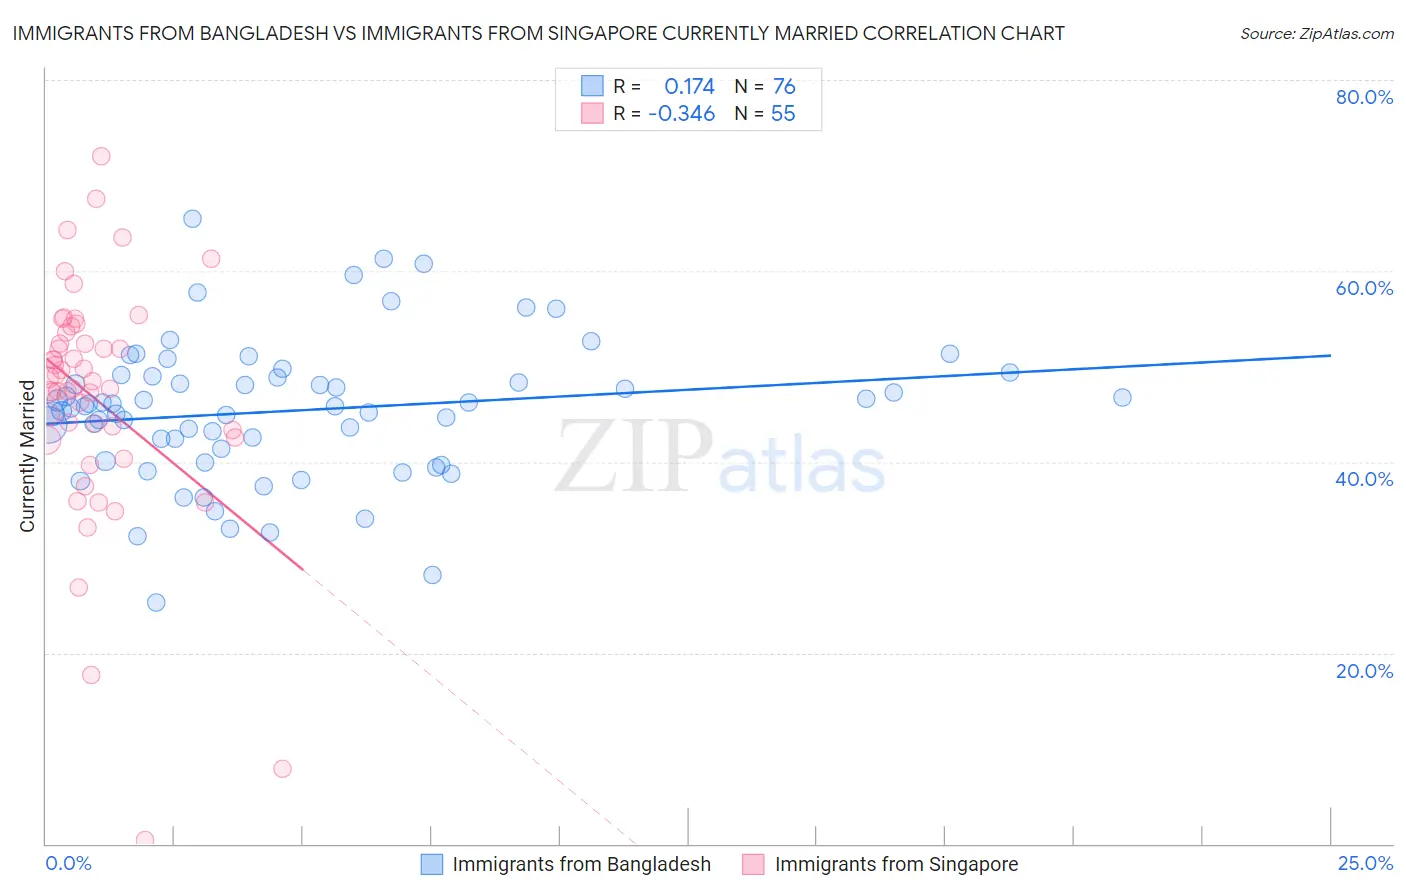
Immigrants from Bangladesh vs Immigrants from Singapore Currently Married Correlation Chart
The statistical analysis conducted on geographies consisting of 203,666,210 people shows a poor positive correlation between the proportion of Immigrants from Bangladesh and percentage of population currently married in the United States with a correlation coefficient (R) of 0.174 and weighted average of 43.6%. Similarly, the statistical analysis conducted on geographies consisting of 137,494,122 people shows a mild negative correlation between the proportion of Immigrants from Singapore and percentage of population currently married in the United States with a correlation coefficient (R) of -0.346 and weighted average of 47.8%, a difference of 9.5%.
Currently Married Correlation Summary
| Measurement | Immigrants from Bangladesh | Immigrants from Singapore |
| Minimum | 25.3% | 0.40% |
| Maximum | 65.5% | 72.0% |
| Range | 40.2% | 71.6% |
| Mean | 45.4% | 46.7% |
| Median | 45.8% | 48.4% |
| Interquartile 25% (IQ1) | 40.7% | 42.6% |
| Interquartile 75% (IQ3) | 48.9% | 53.5% |
| Interquartile Range (IQR) | 8.2% | 10.9% |
| Standard Deviation (Sample) | 7.4% | 12.7% |
| Standard Deviation (Population) | 7.3% | 12.6% |
Similar Demographics by Currently Married
Demographics Similar to Immigrants from Bangladesh by Currently Married
In terms of currently married, the demographic groups most similar to Immigrants from Bangladesh are Ecuadorian (43.6%, a difference of 0.070%), Sudanese (43.7%, a difference of 0.080%), Immigrants from Cuba (43.7%, a difference of 0.10%), Immigrants from Eritrea (43.6%, a difference of 0.10%), and Spanish American Indian (43.6%, a difference of 0.10%).
| Demographics | Rating | Rank | Currently Married |
| Ute | 0.2 /100 | #258 | Tragic 43.9% |
| Immigrants | Sierra Leone | 0.1 /100 | #259 | Tragic 43.8% |
| Immigrants | Latin America | 0.1 /100 | #260 | Tragic 43.8% |
| Immigrants | Nicaragua | 0.1 /100 | #261 | Tragic 43.7% |
| Bangladeshis | 0.1 /100 | #262 | Tragic 43.7% |
| Immigrants | Cuba | 0.1 /100 | #263 | Tragic 43.7% |
| Sudanese | 0.1 /100 | #264 | Tragic 43.7% |
| Immigrants | Bangladesh | 0.1 /100 | #265 | Tragic 43.6% |
| Ecuadorians | 0.1 /100 | #266 | Tragic 43.6% |
| Immigrants | Eritrea | 0.1 /100 | #267 | Tragic 43.6% |
| Spanish American Indians | 0.1 /100 | #268 | Tragic 43.6% |
| Immigrants | Sudan | 0.1 /100 | #269 | Tragic 43.5% |
| Salvadorans | 0.1 /100 | #270 | Tragic 43.5% |
| Bermudans | 0.1 /100 | #271 | Tragic 43.5% |
| Indonesians | 0.1 /100 | #272 | Tragic 43.5% |
Demographics Similar to Immigrants from Singapore by Currently Married
In terms of currently married, the demographic groups most similar to Immigrants from Singapore are Immigrants from Greece (47.7%, a difference of 0.030%), Serbian (47.8%, a difference of 0.050%), Immigrants from Italy (47.7%, a difference of 0.060%), Cypriot (47.8%, a difference of 0.070%), and Turkish (47.8%, a difference of 0.090%).
| Demographics | Rating | Rank | Currently Married |
| Immigrants | China | 94.7 /100 | #98 | Exceptional 47.9% |
| Immigrants | Sweden | 94.3 /100 | #99 | Exceptional 47.8% |
| Celtics | 94.2 /100 | #100 | Exceptional 47.8% |
| Immigrants | Germany | 94.1 /100 | #101 | Exceptional 47.8% |
| Turks | 93.9 /100 | #102 | Exceptional 47.8% |
| Cypriots | 93.7 /100 | #103 | Exceptional 47.8% |
| Serbians | 93.6 /100 | #104 | Exceptional 47.8% |
| Immigrants | Singapore | 93.3 /100 | #105 | Exceptional 47.8% |
| Immigrants | Greece | 93.1 /100 | #106 | Exceptional 47.7% |
| Immigrants | Italy | 92.9 /100 | #107 | Exceptional 47.7% |
| Tsimshian | 92.4 /100 | #108 | Exceptional 47.7% |
| Immigrants | Egypt | 92.3 /100 | #109 | Exceptional 47.7% |
| Immigrants | Russia | 92.0 /100 | #110 | Exceptional 47.7% |
| Immigrants | Hungary | 91.2 /100 | #111 | Exceptional 47.6% |
| Immigrants | Western Europe | 91.1 /100 | #112 | Exceptional 47.6% |