Immigrants from Bahamas vs Belizean Unemployment Among Ages 16 to 19 years
COMPARE
Immigrants from Bahamas
Belizean
Unemployment Among Ages 16 to 19 years
Unemployment Among Ages 16 to 19 years Comparison
Immigrants from Bahamas
Belizeans
20.4%
UNEMPLOYMENT AMONG AGES 16 TO 19 YEARS
0.0/ 100
METRIC RATING
293rd/ 347
METRIC RANK
21.6%
UNEMPLOYMENT AMONG AGES 16 TO 19 YEARS
0.0/ 100
METRIC RATING
311th/ 347
METRIC RANK
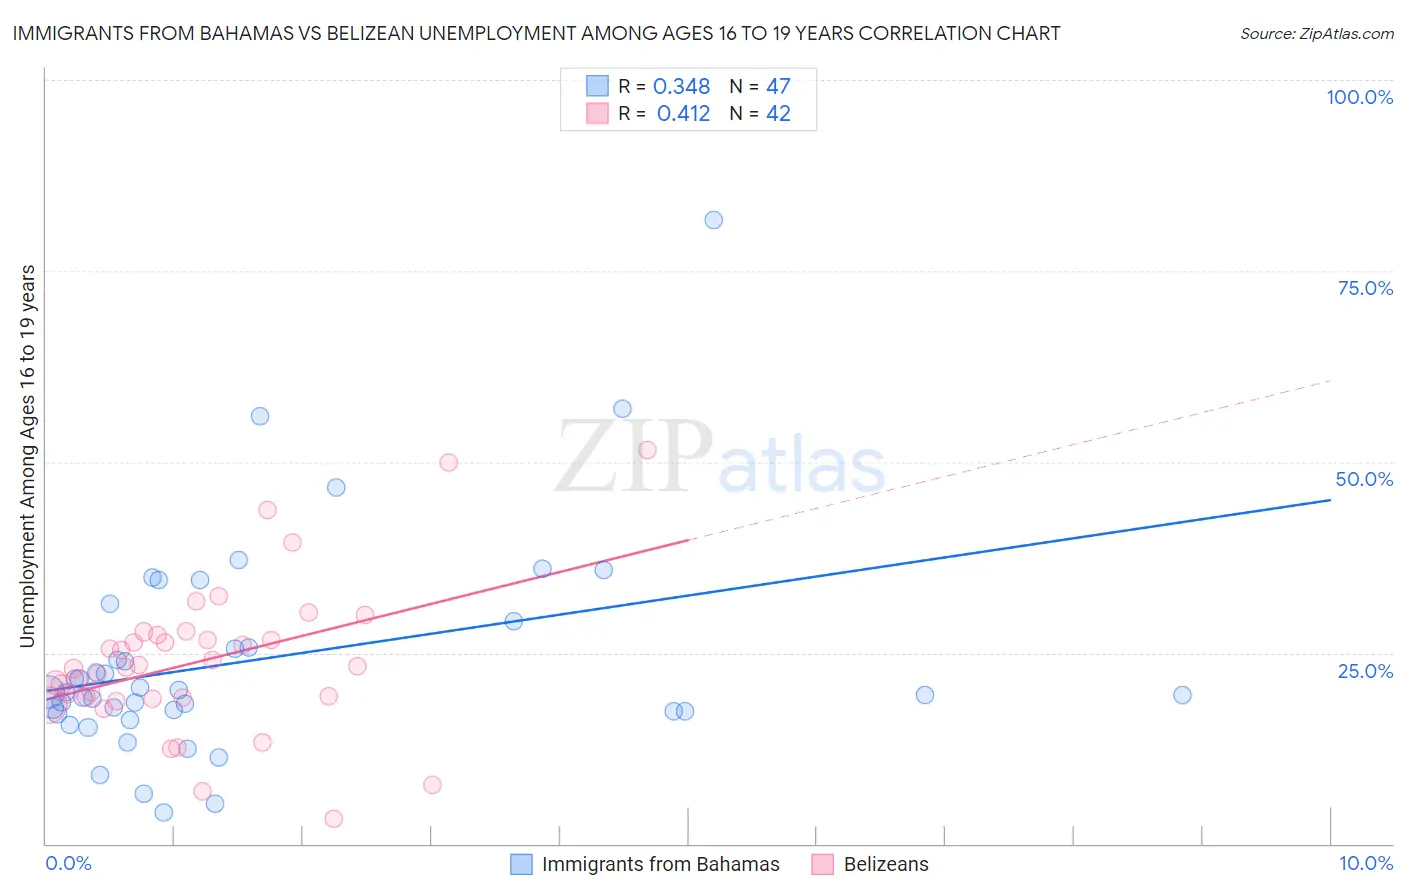
Immigrants from Bahamas vs Belizean Unemployment Among Ages 16 to 19 years Correlation Chart
The statistical analysis conducted on geographies consisting of 102,900,667 people shows a mild positive correlation between the proportion of Immigrants from Bahamas and unemployment rate among population between the ages 16 and 19 in the United States with a correlation coefficient (R) of 0.348 and weighted average of 20.4%. Similarly, the statistical analysis conducted on geographies consisting of 141,937,009 people shows a moderate positive correlation between the proportion of Belizeans and unemployment rate among population between the ages 16 and 19 in the United States with a correlation coefficient (R) of 0.412 and weighted average of 21.6%, a difference of 5.9%.
Unemployment Among Ages 16 to 19 years Correlation Summary
| Measurement | Immigrants from Bahamas | Belizean |
| Minimum | 4.1% | 3.2% |
| Maximum | 81.7% | 51.6% |
| Range | 77.6% | 48.4% |
| Mean | 24.0% | 23.9% |
| Median | 19.8% | 23.2% |
| Interquartile 25% (IQ1) | 17.3% | 19.1% |
| Interquartile 75% (IQ3) | 29.2% | 27.4% |
| Interquartile Range (IQR) | 11.9% | 8.3% |
| Standard Deviation (Sample) | 14.2% | 9.8% |
| Standard Deviation (Population) | 14.0% | 9.7% |
Demographics Similar to Immigrants from Bahamas and Belizeans by Unemployment Among Ages 16 to 19 years
In terms of unemployment among ages 16 to 19 years, the demographic groups most similar to Immigrants from Bahamas are Immigrants from Haiti (20.4%, a difference of 0.26%), Central American Indian (20.4%, a difference of 0.32%), Armenian (20.5%, a difference of 0.61%), Comanche (20.2%, a difference of 0.63%), and Alsatian (20.5%, a difference of 0.64%). Similarly, the demographic groups most similar to Belizeans are Vietnamese (21.5%, a difference of 0.22%), Houma (21.6%, a difference of 0.26%), Native/Alaskan (21.5%, a difference of 0.28%), Immigrants from Bangladesh (21.5%, a difference of 0.44%), and Black/African American (21.4%, a difference of 0.82%).
| Demographics | Rating | Rank | Unemployment Among Ages 16 to 19 years |
| Comanche | 0.0 /100 | #292 | Tragic 20.2% |
| Immigrants | Bahamas | 0.0 /100 | #293 | Tragic 20.4% |
| Immigrants | Haiti | 0.0 /100 | #294 | Tragic 20.4% |
| Central American Indians | 0.0 /100 | #295 | Tragic 20.4% |
| Armenians | 0.0 /100 | #296 | Tragic 20.5% |
| Alsatians | 0.0 /100 | #297 | Tragic 20.5% |
| Haitians | 0.0 /100 | #298 | Tragic 20.5% |
| Immigrants | Uzbekistan | 0.0 /100 | #299 | Tragic 20.5% |
| Ecuadorians | 0.0 /100 | #300 | Tragic 20.5% |
| Immigrants | Ecuador | 0.0 /100 | #301 | Tragic 20.9% |
| Immigrants | Caribbean | 0.0 /100 | #302 | Tragic 20.9% |
| Senegalese | 0.0 /100 | #303 | Tragic 21.0% |
| Aleuts | 0.0 /100 | #304 | Tragic 21.2% |
| Immigrants | Senegal | 0.0 /100 | #305 | Tragic 21.2% |
| U.S. Virgin Islanders | 0.0 /100 | #306 | Tragic 21.3% |
| Blacks/African Americans | 0.0 /100 | #307 | Tragic 21.4% |
| Immigrants | Bangladesh | 0.0 /100 | #308 | Tragic 21.5% |
| Natives/Alaskans | 0.0 /100 | #309 | Tragic 21.5% |
| Vietnamese | 0.0 /100 | #310 | Tragic 21.5% |
| Belizeans | 0.0 /100 | #311 | Tragic 21.6% |
| Houma | 0.0 /100 | #312 | Tragic 21.6% |