Immigrants from the Azores vs Immigrants from Peru Disability Age 35 to 64
COMPARE
Immigrants from the Azores
Immigrants from Peru
Disability Age 35 to 64
Disability Age 35 to 64 Comparison
Immigrants from the Azores
Immigrants from Peru
14.3%
DISABILITY AGE 35 TO 64
0.0/ 100
METRIC RATING
311th/ 347
METRIC RANK
9.8%
DISABILITY AGE 35 TO 64
99.9/ 100
METRIC RATING
45th/ 347
METRIC RANK
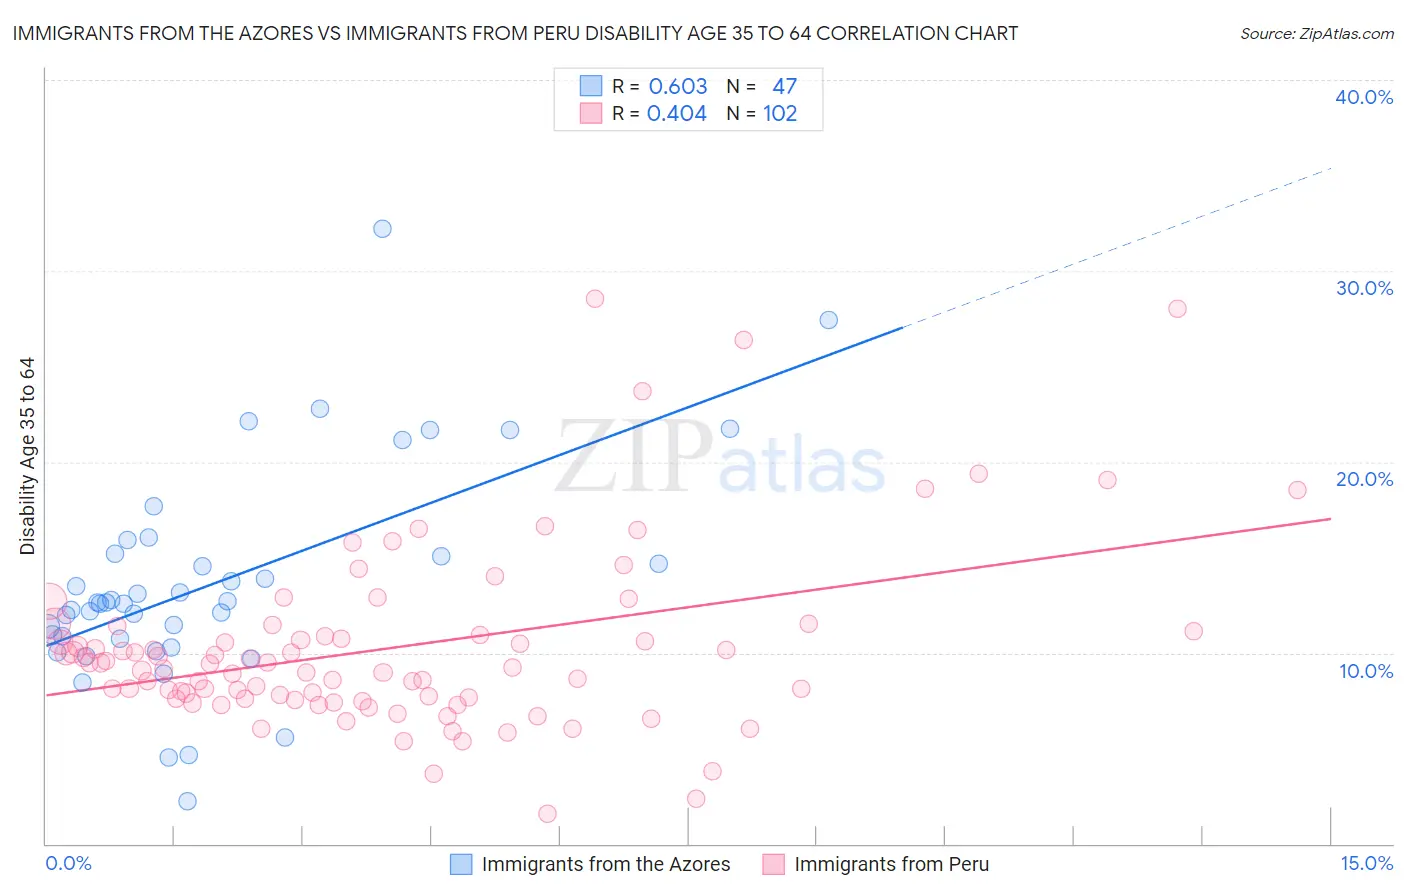
Immigrants from the Azores vs Immigrants from Peru Disability Age 35 to 64 Correlation Chart
The statistical analysis conducted on geographies consisting of 46,256,915 people shows a significant positive correlation between the proportion of Immigrants from the Azores and percentage of population with a disability between the ages 34 and 64 in the United States with a correlation coefficient (R) of 0.603 and weighted average of 14.3%. Similarly, the statistical analysis conducted on geographies consisting of 328,733,403 people shows a moderate positive correlation between the proportion of Immigrants from Peru and percentage of population with a disability between the ages 34 and 64 in the United States with a correlation coefficient (R) of 0.404 and weighted average of 9.8%, a difference of 45.7%.
Disability Age 35 to 64 Correlation Summary
| Measurement | Immigrants from the Azores | Immigrants from Peru |
| Minimum | 2.2% | 1.6% |
| Maximum | 32.2% | 28.5% |
| Range | 30.0% | 27.0% |
| Mean | 13.7% | 10.3% |
| Median | 12.6% | 9.3% |
| Interquartile 25% (IQ1) | 10.7% | 7.6% |
| Interquartile 75% (IQ3) | 15.2% | 11.0% |
| Interquartile Range (IQR) | 4.5% | 3.4% |
| Standard Deviation (Sample) | 5.7% | 4.7% |
| Standard Deviation (Population) | 5.7% | 4.7% |
Similar Demographics by Disability Age 35 to 64
Demographics Similar to Immigrants from the Azores by Disability Age 35 to 64
In terms of disability age 35 to 64, the demographic groups most similar to Immigrants from the Azores are Paiute (14.3%, a difference of 0.15%), Iroquois (14.4%, a difference of 0.58%), Cape Verdean (14.1%, a difference of 0.92%), Shoshone (14.5%, a difference of 1.3%), and Alaska Native (14.5%, a difference of 1.4%).
| Demographics | Rating | Rank | Disability Age 35 to 64 |
| Hopi | 0.0 /100 | #304 | Tragic 13.9% |
| Americans | 0.0 /100 | #305 | Tragic 13.9% |
| Immigrants | Yemen | 0.0 /100 | #306 | Tragic 14.0% |
| Blackfeet | 0.0 /100 | #307 | Tragic 14.1% |
| Inupiat | 0.0 /100 | #308 | Tragic 14.1% |
| Cree | 0.0 /100 | #309 | Tragic 14.1% |
| Cape Verdeans | 0.0 /100 | #310 | Tragic 14.1% |
| Immigrants | Azores | 0.0 /100 | #311 | Tragic 14.3% |
| Paiute | 0.0 /100 | #312 | Tragic 14.3% |
| Iroquois | 0.0 /100 | #313 | Tragic 14.4% |
| Shoshone | 0.0 /100 | #314 | Tragic 14.5% |
| Alaska Natives | 0.0 /100 | #315 | Tragic 14.5% |
| Osage | 0.0 /100 | #316 | Tragic 14.5% |
| Crow | 0.0 /100 | #317 | Tragic 14.6% |
| Ottawa | 0.0 /100 | #318 | Tragic 14.6% |
Demographics Similar to Immigrants from Peru by Disability Age 35 to 64
In terms of disability age 35 to 64, the demographic groups most similar to Immigrants from Peru are Immigrants from Egypt (9.8%, a difference of 0.060%), Cambodian (9.8%, a difference of 0.18%), Immigrants from Belgium (9.8%, a difference of 0.24%), Immigrants from Serbia (9.8%, a difference of 0.25%), and Immigrants from Greece (9.8%, a difference of 0.29%).
| Demographics | Rating | Rank | Disability Age 35 to 64 |
| Egyptians | 99.9 /100 | #38 | Exceptional 9.7% |
| Immigrants | Belarus | 99.9 /100 | #39 | Exceptional 9.7% |
| Immigrants | Armenia | 99.9 /100 | #40 | Exceptional 9.7% |
| Israelis | 99.9 /100 | #41 | Exceptional 9.7% |
| Immigrants | Malaysia | 99.9 /100 | #42 | Exceptional 9.7% |
| Immigrants | Colombia | 99.9 /100 | #43 | Exceptional 9.8% |
| Immigrants | Egypt | 99.9 /100 | #44 | Exceptional 9.8% |
| Immigrants | Peru | 99.9 /100 | #45 | Exceptional 9.8% |
| Cambodians | 99.8 /100 | #46 | Exceptional 9.8% |
| Immigrants | Belgium | 99.8 /100 | #47 | Exceptional 9.8% |
| Immigrants | Serbia | 99.8 /100 | #48 | Exceptional 9.8% |
| Immigrants | Greece | 99.8 /100 | #49 | Exceptional 9.8% |
| Paraguayans | 99.8 /100 | #50 | Exceptional 9.8% |
| Bhutanese | 99.8 /100 | #51 | Exceptional 9.8% |
| Immigrants | Bulgaria | 99.8 /100 | #52 | Exceptional 9.8% |