Immigrants from Austria vs Immigrants from Southern Europe Male Disability
COMPARE
Immigrants from Austria
Immigrants from Southern Europe
Male Disability
Male Disability Comparison
Immigrants from Austria
Immigrants from Southern Europe
11.4%
MALE DISABILITY
27.3/ 100
METRIC RATING
187th/ 347
METRIC RANK
11.2%
MALE DISABILITY
54.4/ 100
METRIC RATING
167th/ 347
METRIC RANK
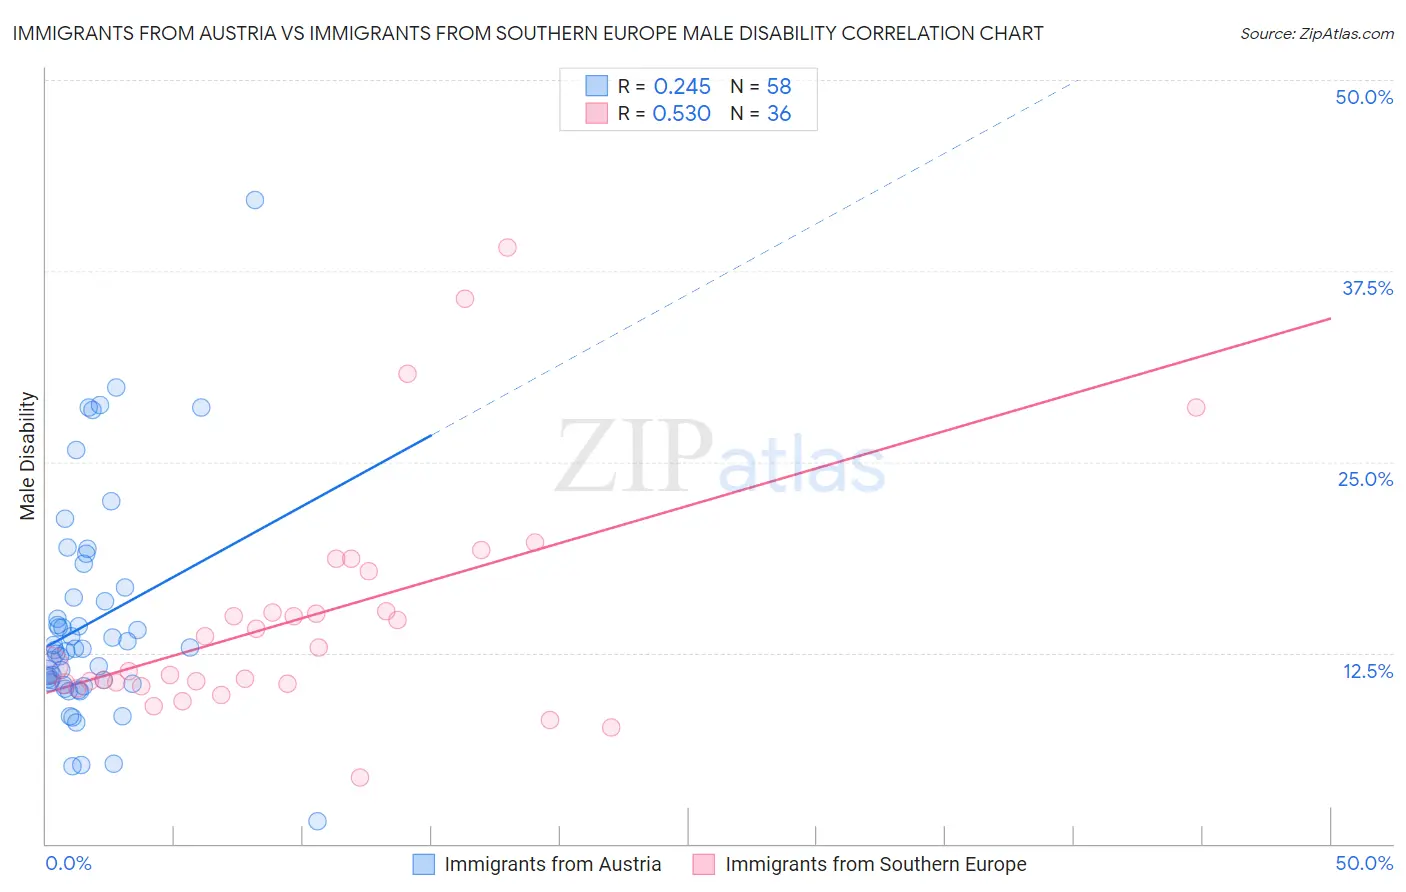
Immigrants from Austria vs Immigrants from Southern Europe Male Disability Correlation Chart
The statistical analysis conducted on geographies consisting of 167,973,228 people shows a weak positive correlation between the proportion of Immigrants from Austria and percentage of males with a disability in the United States with a correlation coefficient (R) of 0.245 and weighted average of 11.4%. Similarly, the statistical analysis conducted on geographies consisting of 402,778,733 people shows a substantial positive correlation between the proportion of Immigrants from Southern Europe and percentage of males with a disability in the United States with a correlation coefficient (R) of 0.530 and weighted average of 11.2%, a difference of 1.6%.
Male Disability Correlation Summary
| Measurement | Immigrants from Austria | Immigrants from Southern Europe |
| Minimum | 1.4% | 4.3% |
| Maximum | 42.1% | 39.0% |
| Range | 40.7% | 34.7% |
| Mean | 14.5% | 14.9% |
| Median | 12.7% | 12.3% |
| Interquartile 25% (IQ1) | 10.5% | 10.5% |
| Interquartile 75% (IQ3) | 16.1% | 16.5% |
| Interquartile Range (IQR) | 5.7% | 6.0% |
| Standard Deviation (Sample) | 7.2% | 7.7% |
| Standard Deviation (Population) | 7.2% | 7.6% |
Demographics Similar to Immigrants from Austria and Immigrants from Southern Europe by Male Disability
In terms of male disability, the demographic groups most similar to Immigrants from Austria are Immigrants from Zaire (11.4%, a difference of 0.020%), Pakistani (11.3%, a difference of 0.20%), Iraqi (11.3%, a difference of 0.21%), Immigrants from Central America (11.3%, a difference of 0.37%), and Immigrants from Belize (11.3%, a difference of 0.41%). Similarly, the demographic groups most similar to Immigrants from Southern Europe are Immigrants from Latin America (11.2%, a difference of 0.020%), Barbadian (11.2%, a difference of 0.060%), New Zealander (11.2%, a difference of 0.080%), Haitian (11.2%, a difference of 0.10%), and Romanian (11.2%, a difference of 0.20%).
| Demographics | Rating | Rank | Male Disability |
| Immigrants | Southern Europe | 54.4 /100 | #167 | Average 11.2% |
| Immigrants | Latin America | 54.0 /100 | #168 | Average 11.2% |
| Barbadians | 53.4 /100 | #169 | Average 11.2% |
| New Zealanders | 52.9 /100 | #170 | Average 11.2% |
| Haitians | 52.5 /100 | #171 | Average 11.2% |
| Romanians | 50.7 /100 | #172 | Average 11.2% |
| Immigrants | Burma/Myanmar | 50.4 /100 | #173 | Average 11.2% |
| Maltese | 50.0 /100 | #174 | Average 11.2% |
| Immigrants | Honduras | 48.7 /100 | #175 | Average 11.2% |
| Syrians | 46.6 /100 | #176 | Average 11.2% |
| Immigrants | Norway | 44.2 /100 | #177 | Average 11.3% |
| Australians | 42.2 /100 | #178 | Average 11.3% |
| Immigrants | Caribbean | 41.4 /100 | #179 | Average 11.3% |
| Hondurans | 41.1 /100 | #180 | Average 11.3% |
| Immigrants | Senegal | 34.4 /100 | #181 | Fair 11.3% |
| Immigrants | Belize | 33.7 /100 | #182 | Fair 11.3% |
| Immigrants | Central America | 32.9 /100 | #183 | Fair 11.3% |
| Iraqis | 30.5 /100 | #184 | Fair 11.3% |
| Pakistanis | 30.3 /100 | #185 | Fair 11.3% |
| Immigrants | Zaire | 27.6 /100 | #186 | Fair 11.4% |
| Immigrants | Austria | 27.3 /100 | #187 | Fair 11.4% |