Immigrants from Albania vs Yaqui Disability Age 35 to 64
COMPARE
Immigrants from Albania
Yaqui
Disability Age 35 to 64
Disability Age 35 to 64 Comparison
Immigrants from Albania
Yaqui
10.7%
DISABILITY AGE 35 TO 64
92.5/ 100
METRIC RATING
132nd/ 347
METRIC RANK
13.5%
DISABILITY AGE 35 TO 64
0.0/ 100
METRIC RATING
294th/ 347
METRIC RANK
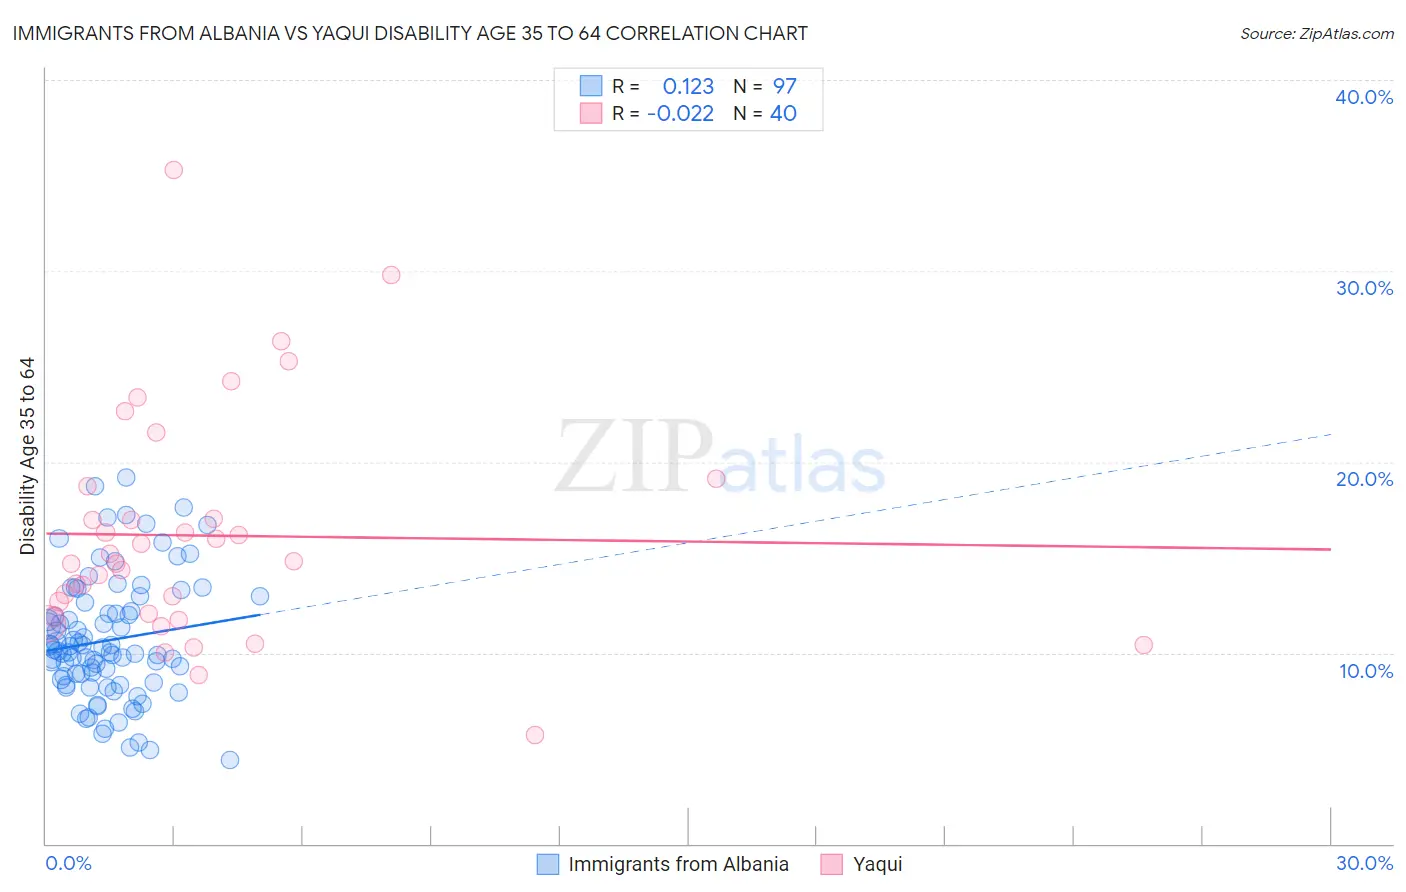
Immigrants from Albania vs Yaqui Disability Age 35 to 64 Correlation Chart
The statistical analysis conducted on geographies consisting of 119,389,382 people shows a poor positive correlation between the proportion of Immigrants from Albania and percentage of population with a disability between the ages 34 and 64 in the United States with a correlation coefficient (R) of 0.123 and weighted average of 10.7%. Similarly, the statistical analysis conducted on geographies consisting of 107,720,635 people shows no correlation between the proportion of Yaqui and percentage of population with a disability between the ages 34 and 64 in the United States with a correlation coefficient (R) of -0.022 and weighted average of 13.5%, a difference of 25.8%.
Disability Age 35 to 64 Correlation Summary
| Measurement | Immigrants from Albania | Yaqui |
| Minimum | 4.4% | 5.7% |
| Maximum | 19.1% | 35.3% |
| Range | 14.8% | 29.6% |
| Mean | 10.7% | 16.1% |
| Median | 10.1% | 14.8% |
| Interquartile 25% (IQ1) | 8.5% | 12.0% |
| Interquartile 75% (IQ3) | 12.4% | 17.9% |
| Interquartile Range (IQR) | 3.9% | 5.9% |
| Standard Deviation (Sample) | 3.2% | 6.0% |
| Standard Deviation (Population) | 3.2% | 5.9% |
Similar Demographics by Disability Age 35 to 64
Demographics Similar to Immigrants from Albania by Disability Age 35 to 64
In terms of disability age 35 to 64, the demographic groups most similar to Immigrants from Albania are Immigrants (10.7%, a difference of 0.0%), Immigrants from Ecuador (10.7%, a difference of 0.010%), Greek (10.7%, a difference of 0.050%), Immigrants from El Salvador (10.7%, a difference of 0.11%), and Immigrants from Syria (10.7%, a difference of 0.16%).
| Demographics | Rating | Rank | Disability Age 35 to 64 |
| Albanians | 94.2 /100 | #125 | Exceptional 10.6% |
| Immigrants | Afghanistan | 94.1 /100 | #126 | Exceptional 10.6% |
| Immigrants | Zimbabwe | 94.0 /100 | #127 | Exceptional 10.6% |
| South Africans | 93.3 /100 | #128 | Exceptional 10.7% |
| Ecuadorians | 93.1 /100 | #129 | Exceptional 10.7% |
| Immigrants | Syria | 93.0 /100 | #130 | Exceptional 10.7% |
| Immigrants | El Salvador | 92.8 /100 | #131 | Exceptional 10.7% |
| Immigrants | Albania | 92.5 /100 | #132 | Exceptional 10.7% |
| Immigrants | Immigrants | 92.5 /100 | #133 | Exceptional 10.7% |
| Immigrants | Ecuador | 92.5 /100 | #134 | Exceptional 10.7% |
| Greeks | 92.3 /100 | #135 | Exceptional 10.7% |
| Salvadorans | 91.9 /100 | #136 | Exceptional 10.7% |
| Immigrants | Costa Rica | 91.7 /100 | #137 | Exceptional 10.7% |
| Immigrants | Southern Europe | 91.5 /100 | #138 | Exceptional 10.7% |
| Costa Ricans | 91.4 /100 | #139 | Exceptional 10.7% |
Demographics Similar to Yaqui by Disability Age 35 to 64
In terms of disability age 35 to 64, the demographic groups most similar to Yaqui are Ute (13.4%, a difference of 0.58%), Yakama (13.6%, a difference of 0.68%), African (13.6%, a difference of 0.90%), Puget Sound Salish (13.3%, a difference of 1.1%), and Immigrants from Congo (13.3%, a difference of 1.1%).
| Demographics | Rating | Rank | Disability Age 35 to 64 |
| Tlingit-Haida | 0.0 /100 | #287 | Tragic 13.2% |
| Fijians | 0.0 /100 | #288 | Tragic 13.2% |
| Indonesians | 0.0 /100 | #289 | Tragic 13.2% |
| Immigrants | Liberia | 0.0 /100 | #290 | Tragic 13.2% |
| Immigrants | Congo | 0.0 /100 | #291 | Tragic 13.3% |
| Puget Sound Salish | 0.0 /100 | #292 | Tragic 13.3% |
| Ute | 0.0 /100 | #293 | Tragic 13.4% |
| Yaqui | 0.0 /100 | #294 | Tragic 13.5% |
| Yakama | 0.0 /100 | #295 | Tragic 13.6% |
| Africans | 0.0 /100 | #296 | Tragic 13.6% |
| Bangladeshis | 0.0 /100 | #297 | Tragic 13.6% |
| Cheyenne | 0.0 /100 | #298 | Tragic 13.6% |
| Spanish Americans | 0.0 /100 | #299 | Tragic 13.7% |
| Delaware | 0.0 /100 | #300 | Tragic 13.7% |
| French American Indians | 0.0 /100 | #301 | Tragic 13.7% |