Uruguayan vs Crow Disability Age 5 to 17
COMPARE
Uruguayan
Crow
Disability Age 5 to 17
Disability Age 5 to 17 Comparison
Uruguayans
Crow
5.6%
DISABILITY AGE 5 TO 17
51.0/ 100
METRIC RATING
173rd/ 347
METRIC RANK
5.4%
DISABILITY AGE 5 TO 17
95.0/ 100
METRIC RATING
124th/ 347
METRIC RANK
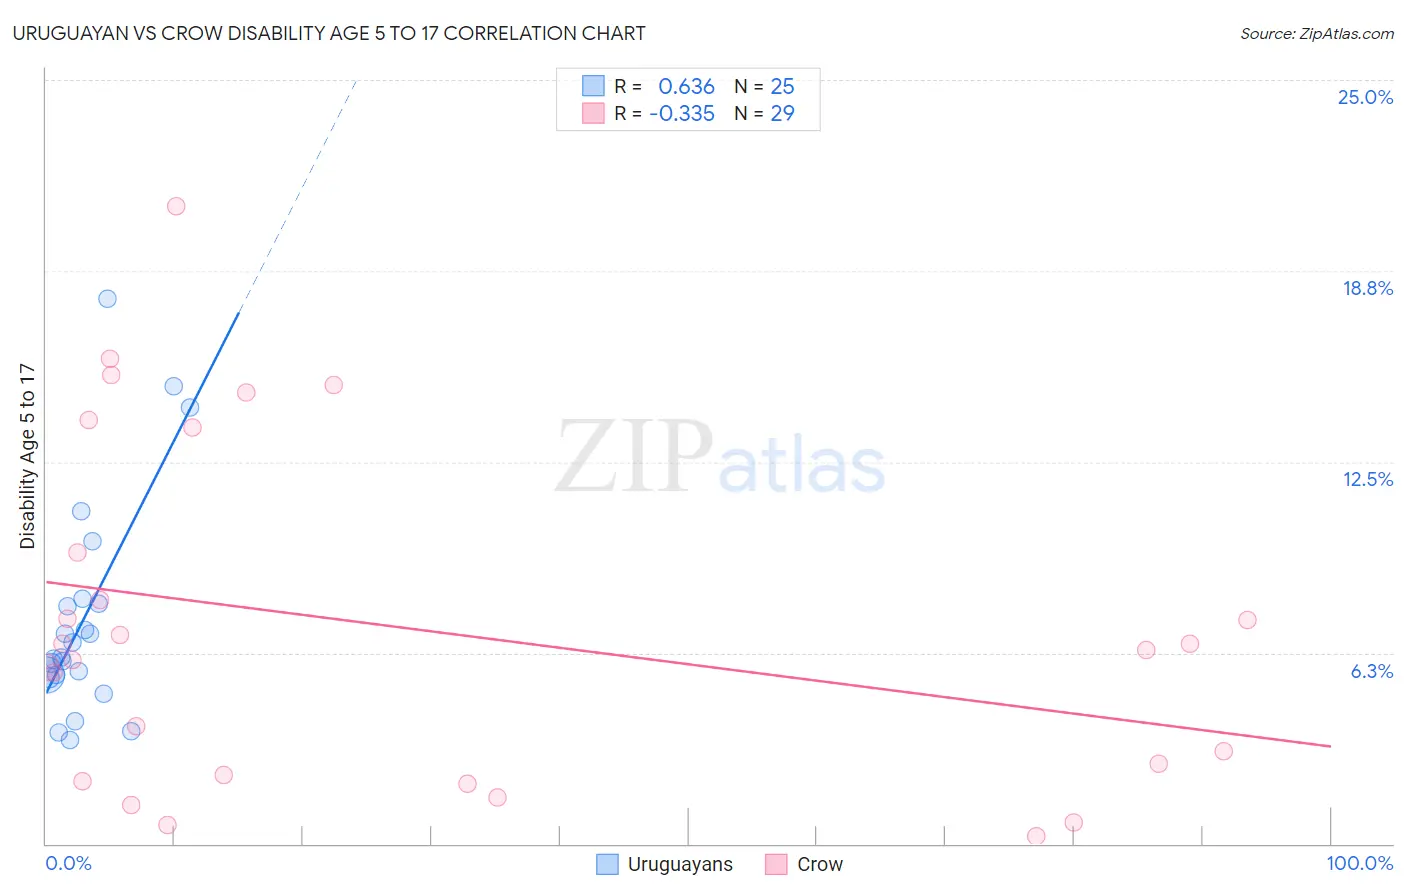
Uruguayan vs Crow Disability Age 5 to 17 Correlation Chart
The statistical analysis conducted on geographies consisting of 144,432,233 people shows a significant positive correlation between the proportion of Uruguayans and percentage of population with a disability between the ages 5 and 17 in the United States with a correlation coefficient (R) of 0.636 and weighted average of 5.6%. Similarly, the statistical analysis conducted on geographies consisting of 59,063,912 people shows a mild negative correlation between the proportion of Crow and percentage of population with a disability between the ages 5 and 17 in the United States with a correlation coefficient (R) of -0.335 and weighted average of 5.4%, a difference of 3.7%.
Disability Age 5 to 17 Correlation Summary
| Measurement | Uruguayan | Crow |
| Minimum | 3.4% | 0.26% |
| Maximum | 17.9% | 20.9% |
| Range | 14.5% | 20.6% |
| Mean | 7.4% | 7.1% |
| Median | 6.1% | 6.4% |
| Interquartile 25% (IQ1) | 5.5% | 2.1% |
| Interquartile 75% (IQ3) | 7.9% | 11.6% |
| Interquartile Range (IQR) | 2.5% | 9.4% |
| Standard Deviation (Sample) | 3.6% | 5.6% |
| Standard Deviation (Population) | 3.6% | 5.5% |
Similar Demographics by Disability Age 5 to 17
Demographics Similar to Uruguayans by Disability Age 5 to 17
In terms of disability age 5 to 17, the demographic groups most similar to Uruguayans are Ukrainian (5.6%, a difference of 0.030%), Costa Rican (5.6%, a difference of 0.050%), Shoshone (5.6%, a difference of 0.080%), Immigrants from Central America (5.6%, a difference of 0.080%), and Serbian (5.6%, a difference of 0.15%).
| Demographics | Rating | Rank | Disability Age 5 to 17 |
| Greeks | 60.6 /100 | #166 | Good 5.6% |
| Immigrants | Burma/Myanmar | 59.3 /100 | #167 | Average 5.6% |
| Iraqis | 56.0 /100 | #168 | Average 5.6% |
| Immigrants | Norway | 55.7 /100 | #169 | Average 5.6% |
| Serbians | 54.0 /100 | #170 | Average 5.6% |
| Immigrants | Iraq | 53.9 /100 | #171 | Average 5.6% |
| Ukrainians | 51.5 /100 | #172 | Average 5.6% |
| Uruguayans | 51.0 /100 | #173 | Average 5.6% |
| Costa Ricans | 50.0 /100 | #174 | Average 5.6% |
| Shoshone | 49.4 /100 | #175 | Average 5.6% |
| Immigrants | Central America | 49.4 /100 | #176 | Average 5.6% |
| Immigrants | Western Europe | 47.8 /100 | #177 | Average 5.6% |
| Immigrants | Trinidad and Tobago | 47.6 /100 | #178 | Average 5.6% |
| Immigrants | Barbados | 40.5 /100 | #179 | Average 5.6% |
| Immigrants | Uruguay | 37.7 /100 | #180 | Fair 5.6% |
Demographics Similar to Crow by Disability Age 5 to 17
In terms of disability age 5 to 17, the demographic groups most similar to Crow are Immigrants from Chile (5.4%, a difference of 0.010%), New Zealander (5.4%, a difference of 0.020%), Latvian (5.4%, a difference of 0.030%), Immigrants from Ethiopia (5.4%, a difference of 0.13%), and Immigrants from Venezuela (5.4%, a difference of 0.14%).
| Demographics | Rating | Rank | Disability Age 5 to 17 |
| Immigrants | Afghanistan | 97.4 /100 | #117 | Exceptional 5.3% |
| South Americans | 97.1 /100 | #118 | Exceptional 5.4% |
| Immigrants | South America | 97.1 /100 | #119 | Exceptional 5.4% |
| Immigrants | Immigrants | 97.0 /100 | #120 | Exceptional 5.4% |
| Maltese | 96.0 /100 | #121 | Exceptional 5.4% |
| Chileans | 95.8 /100 | #122 | Exceptional 5.4% |
| Immigrants | Ethiopia | 95.5 /100 | #123 | Exceptional 5.4% |
| Crow | 95.0 /100 | #124 | Exceptional 5.4% |
| Immigrants | Chile | 95.0 /100 | #125 | Exceptional 5.4% |
| New Zealanders | 95.0 /100 | #126 | Exceptional 5.4% |
| Latvians | 95.0 /100 | #127 | Exceptional 5.4% |
| Immigrants | Venezuela | 94.5 /100 | #128 | Exceptional 5.4% |
| Romanians | 94.1 /100 | #129 | Exceptional 5.4% |
| Immigrants | Bulgaria | 94.0 /100 | #130 | Exceptional 5.4% |
| Arabs | 92.9 /100 | #131 | Exceptional 5.4% |