Immigrants from Afghanistan vs Honduran Hearing Disability
COMPARE
Immigrants from Afghanistan
Honduran
Hearing Disability
Hearing Disability Comparison
Immigrants from Afghanistan
Hondurans
2.8%
HEARING DISABILITY
95.3/ 100
METRIC RATING
97th/ 347
METRIC RANK
2.8%
HEARING DISABILITY
93.4/ 100
METRIC RATING
106th/ 347
METRIC RANK
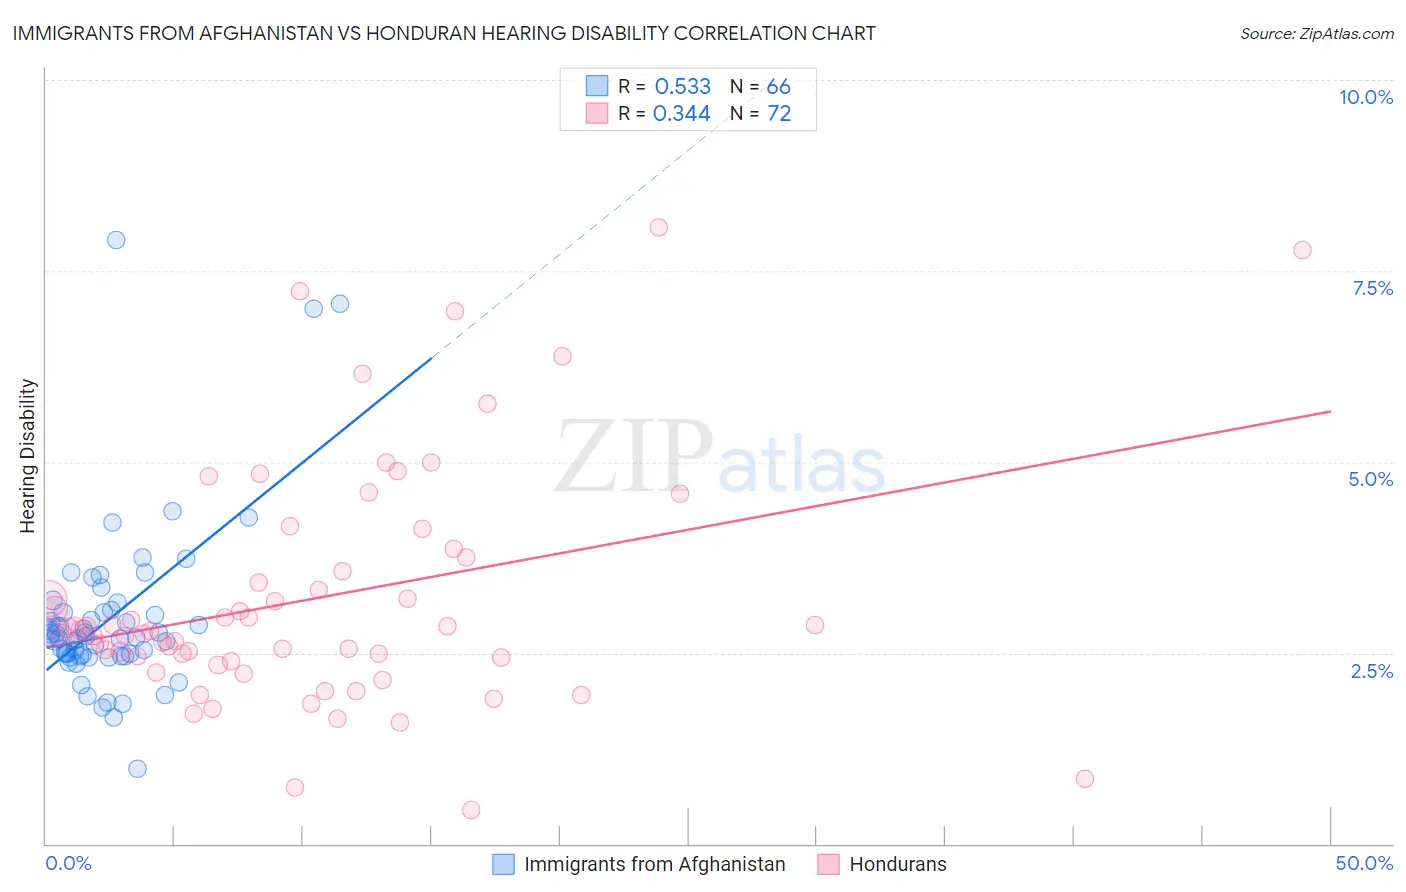
Immigrants from Afghanistan vs Honduran Hearing Disability Correlation Chart
The statistical analysis conducted on geographies consisting of 147,605,800 people shows a substantial positive correlation between the proportion of Immigrants from Afghanistan and percentage of population with hearing disability in the United States with a correlation coefficient (R) of 0.533 and weighted average of 2.8%. Similarly, the statistical analysis conducted on geographies consisting of 357,671,786 people shows a mild positive correlation between the proportion of Hondurans and percentage of population with hearing disability in the United States with a correlation coefficient (R) of 0.344 and weighted average of 2.8%, a difference of 0.89%.
Hearing Disability Correlation Summary
| Measurement | Immigrants from Afghanistan | Honduran |
| Minimum | 0.97% | 0.44% |
| Maximum | 7.9% | 8.1% |
| Range | 6.9% | 7.6% |
| Mean | 2.9% | 3.2% |
| Median | 2.7% | 2.8% |
| Interquartile 25% (IQ1) | 2.5% | 2.4% |
| Interquartile 75% (IQ3) | 3.0% | 3.7% |
| Interquartile Range (IQR) | 0.57% | 1.2% |
| Standard Deviation (Sample) | 1.1% | 1.6% |
| Standard Deviation (Population) | 1.1% | 1.5% |
Demographics Similar to Immigrants from Afghanistan and Hondurans by Hearing Disability
In terms of hearing disability, the demographic groups most similar to Immigrants from Afghanistan are Immigrants from Honduras (2.8%, a difference of 0.060%), Immigrants from Guatemala (2.8%, a difference of 0.10%), Immigrants from Eastern Africa (2.8%, a difference of 0.15%), Immigrants from Somalia (2.8%, a difference of 0.17%), and Immigrants from Spain (2.8%, a difference of 0.21%). Similarly, the demographic groups most similar to Hondurans are Immigrants from Chile (2.8%, a difference of 0.0%), Guatemalan (2.8%, a difference of 0.080%), Turkish (2.8%, a difference of 0.15%), Cypriot (2.8%, a difference of 0.20%), and Moroccan (2.8%, a difference of 0.24%).
| Demographics | Rating | Rank | Hearing Disability |
| Immigrants | Middle Africa | 96.5 /100 | #91 | Exceptional 2.8% |
| Iranians | 96.4 /100 | #92 | Exceptional 2.8% |
| Immigrants | Kuwait | 96.3 /100 | #93 | Exceptional 2.8% |
| Uruguayans | 95.9 /100 | #94 | Exceptional 2.8% |
| Israelis | 95.9 /100 | #95 | Exceptional 2.8% |
| Immigrants | Somalia | 95.5 /100 | #96 | Exceptional 2.8% |
| Immigrants | Afghanistan | 95.3 /100 | #97 | Exceptional 2.8% |
| Immigrants | Honduras | 95.1 /100 | #98 | Exceptional 2.8% |
| Immigrants | Guatemala | 95.1 /100 | #99 | Exceptional 2.8% |
| Immigrants | Eastern Africa | 95.0 /100 | #100 | Exceptional 2.8% |
| Immigrants | Spain | 94.9 /100 | #101 | Exceptional 2.8% |
| Taiwanese | 94.8 /100 | #102 | Exceptional 2.8% |
| Immigrants | Indonesia | 94.7 /100 | #103 | Exceptional 2.8% |
| Burmese | 94.2 /100 | #104 | Exceptional 2.8% |
| Moroccans | 93.9 /100 | #105 | Exceptional 2.8% |
| Hondurans | 93.4 /100 | #106 | Exceptional 2.8% |
| Immigrants | Chile | 93.4 /100 | #107 | Exceptional 2.8% |
| Guatemalans | 93.2 /100 | #108 | Exceptional 2.8% |
| Turks | 93.0 /100 | #109 | Exceptional 2.8% |
| Cypriots | 92.9 /100 | #110 | Exceptional 2.8% |
| Immigrants | Yemen | 92.7 /100 | #111 | Exceptional 2.8% |