Immigrants from Afghanistan vs Slovene Self-Care Disability

COMPARE

Immigrants from Afghanistan
Race
Ancestry
AfghanAfricanAlaska NativeAlaskan AthabascanAlbanianAleutAlsatianAmericanApacheArabArapahoArgentineanArmenianAssyrian/Chaldean/SyriacAustralianAustrianBahamianBangladeshiBarbadianBasqueBelgianBelizeanBermudanBhutaneseBlackfeetBolivianBrazilianBritishBritish West IndianBulgarianBurmeseCajunCambodianCanadianCape VerdeanCarpatho RusynCelticCentral AmericanCentral American IndianCherokeeCheyenneChickasawChileanChineseChippewaChoctawColombianColvilleComancheCosta RicanCreeCreekCroatianCrowCubanCypriotCzechCzechoslovakianDanishDelawareDominicanDutchDutch West IndianEastern EuropeanEcuadorianEgyptianEnglishEstonianEthiopianEuropeanFijianFilipinoFinnishFrenchFrench American IndianFrench CanadianGermanGerman RussianGhanaianGreekGuamanian/ChamorroGuatemalanGuyaneseHaitianHmongHonduranHopiHoumaHungarianIcelanderIndian (Asian)IndonesianInupiatIranianIraqiIrishIroquoisIsraeliItalianJamaicanJapaneseJordanianKenyanKiowaKoreanLaotianLatvianLebaneseLiberianLithuanianLumbeeLuxembourgerMacedonianMalaysianMalteseMarshalleseMenomineeMexicanMexican American IndianMongolianMoroccanNative HawaiianNavajoNepaleseNew ZealanderNicaraguanNigerianNorthern EuropeanNorwegianOkinawanOsageOttawaPaiutePakistaniPalestinianPanamanianParaguayanPennsylvania GermanPeruvianPimaPolishPortuguesePotawatomiPuebloPuerto RicanPuget Sound SalishRomanianRussianSalvadoranSamoanScandinavianScotch-IrishScottishSeminoleSenegaleseSerbianShoshoneSierra LeoneanSiouxSlavicSlovakSomaliSouth AfricanSouth AmericanSouth American IndianSoviet UnionSpaniardSpanishSpanish AmericanSpanish American IndianSri LankanSubsaharan AfricanSudaneseSwedishSwissSyrianTaiwaneseThaiTlingit-HaidaTohono O'OdhamTonganTrinidadian and TobagonianTsimshianTurkishU.S. Virgin IslanderUgandanUkrainianUruguayanUteVenezuelanVietnameseWelshWest IndianYakamaYaquiYugoslavianYumanYup'ikZimbabwean
Immigration
NonimmigrantsImmigrantsAfghanistanAfricaAlbaniaArgentinaArmeniaAsiaAustraliaAustriaBahamasBangladeshBarbadosBelarusBelgiumBelizeBoliviaBosnia and HerzegovinaBrazilBulgariaBurma/MyanmarCabo VerdeCambodiaCameroonCanadaCaribbeanCentral AmericaChileChinaColombiaCongoCosta RicaCroatiaCubaCzechoslovakiaDenmarkDominicaDominican RepublicEastern AfricaEastern AsiaEastern EuropeEcuadorEgyptEl SalvadorEnglandEritreaEthiopiaEuropeFijiFranceGermanyGhanaGreeceGrenadaGuatemalaGuyanaHaitiHondurasHong KongHungaryIndiaIndonesiaIranIraqIrelandIsraelItalyJamaicaJapanJordanKazakhstanKenyaKoreaKuwaitLaosLatin AmericaLatviaLebanonLiberiaLithuaniaMalaysiaMexicoMicronesiaMiddle AfricaMoldovaMoroccoNepalNetherlandsNicaraguaNigeriaNorth AmericaNorth MacedoniaNorthern AfricaNorthern EuropeNorwayOceaniaPakistanPanamaPeruPhilippinesPolandPortugalRomaniaRussiaSaudi ArabiaScotlandSenegalSerbiaSierra LeoneSingaporeSomaliaSouth AfricaSouth AmericaSouth Central AsiaSouth Eastern AsiaSouthern EuropeSpainSri LankaSt. Vincent and the GrenadinesSudanSwedenSwitzerlandSyriaTaiwanThailandTrinidad and TobagoTurkeyUgandaUkraineUruguayUzbekistanVenezuelaVietnamWest IndiesWestern AfricaWestern AsiaWestern EuropeYemenZaireZimbabweAzores
Slovene
Race
Ancestry
AfghanAfricanAlaska NativeAlaskan AthabascanAlbanianAleutAlsatianAmericanApacheArabArapahoArgentineanArmenianAssyrian/Chaldean/SyriacAustralianAustrianBahamianBangladeshiBarbadianBasqueBelgianBelizeanBermudanBhutaneseBlackfeetBolivianBrazilianBritishBritish West IndianBulgarianBurmeseCajunCambodianCanadianCape VerdeanCarpatho RusynCelticCentral AmericanCentral American IndianCherokeeCheyenneChickasawChileanChineseChippewaChoctawColombianColvilleComancheCosta RicanCreeCreekCroatianCrowCubanCypriotCzechCzechoslovakianDanishDelawareDominicanDutchDutch West IndianEastern EuropeanEcuadorianEgyptianEnglishEstonianEthiopianEuropeanFijianFilipinoFinnishFrenchFrench American IndianFrench CanadianGermanGerman RussianGhanaianGreekGuamanian/ChamorroGuatemalanGuyaneseHaitianHmongHonduranHopiHoumaHungarianIcelanderIndian (Asian)IndonesianInupiatIranianIraqiIrishIroquoisIsraeliItalianJamaicanJapaneseJordanianKenyanKiowaKoreanLaotianLatvianLebaneseLiberianLithuanianLumbeeLuxembourgerMacedonianMalaysianMalteseMarshalleseMenomineeMexicanMexican American IndianMongolianMoroccanNative HawaiianNavajoNepaleseNew ZealanderNicaraguanNigerianNorthern EuropeanNorwegianOkinawanOsageOttawaPaiutePakistaniPalestinianPanamanianParaguayanPennsylvania GermanPeruvianPimaPolishPortuguesePotawatomiPuebloPuerto RicanPuget Sound SalishRomanianRussianSalvadoranSamoanScandinavianScotch-IrishScottishSeminoleSenegaleseSerbianShoshoneSierra LeoneanSiouxSlavicSlovakSloveneSomaliSouth AfricanSouth AmericanSouth American IndianSoviet UnionSpaniardSpanishSpanish AmericanSpanish American IndianSri LankanSubsaharan AfricanSudaneseSwedishSwissSyrianTaiwaneseThaiTlingit-HaidaTohono O'OdhamTonganTrinidadian and TobagonianTsimshianTurkishU.S. Virgin IslanderUgandanUkrainianUruguayanUteVenezuelanVietnameseWelshWest IndianYakamaYaquiYugoslavianYumanYup'ikZimbabwean
Immigration
NonimmigrantsImmigrantsAfricaAlbaniaArgentinaArmeniaAsiaAustraliaAustriaBahamasBangladeshBarbadosBelarusBelgiumBelizeBoliviaBosnia and HerzegovinaBrazilBulgariaBurma/MyanmarCabo VerdeCambodiaCameroonCanadaCaribbeanCentral AmericaChileChinaColombiaCongoCosta RicaCroatiaCubaCzechoslovakiaDenmarkDominicaDominican RepublicEastern AfricaEastern AsiaEastern EuropeEcuadorEgyptEl SalvadorEnglandEritreaEthiopiaEuropeFijiFranceGermanyGhanaGreeceGrenadaGuatemalaGuyanaHaitiHondurasHong KongHungaryIndiaIndonesiaIranIraqIrelandIsraelItalyJamaicaJapanJordanKazakhstanKenyaKoreaKuwaitLaosLatin AmericaLatviaLebanonLiberiaLithuaniaMalaysiaMexicoMicronesiaMiddle AfricaMoldovaMoroccoNepalNetherlandsNicaraguaNigeriaNorth AmericaNorth MacedoniaNorthern AfricaNorthern EuropeNorwayOceaniaPakistanPanamaPeruPhilippinesPolandPortugalRomaniaRussiaSaudi ArabiaScotlandSenegalSerbiaSierra LeoneSingaporeSomaliaSouth AfricaSouth AmericaSouth Central AsiaSouth Eastern AsiaSouthern EuropeSpainSri LankaSt. Vincent and the GrenadinesSudanSwedenSwitzerlandSyriaTaiwanThailandTrinidad and TobagoTurkeyUgandaUkraineUruguayUzbekistanVenezuelaVietnamWest IndiesWestern AfricaWestern AsiaWestern EuropeYemenZaireZimbabweAzores
Self-Care Disability
Income
Poverty
Unemployment
Labor Participation
Family Structure
Vehicle Availability
Education Level
Disability

Self-Care Disability Comparison

Immigrants from Afghanistan

Slovenes

Average
Exceptional
2.5%
SELF-CARE DISABILITY
47.6/ 100
METRIC RATING
176th/ 347
METRIC RANK
2.4%
SELF-CARE DISABILITY
94.1/ 100
METRIC RATING
109th/ 347
METRIC RANK

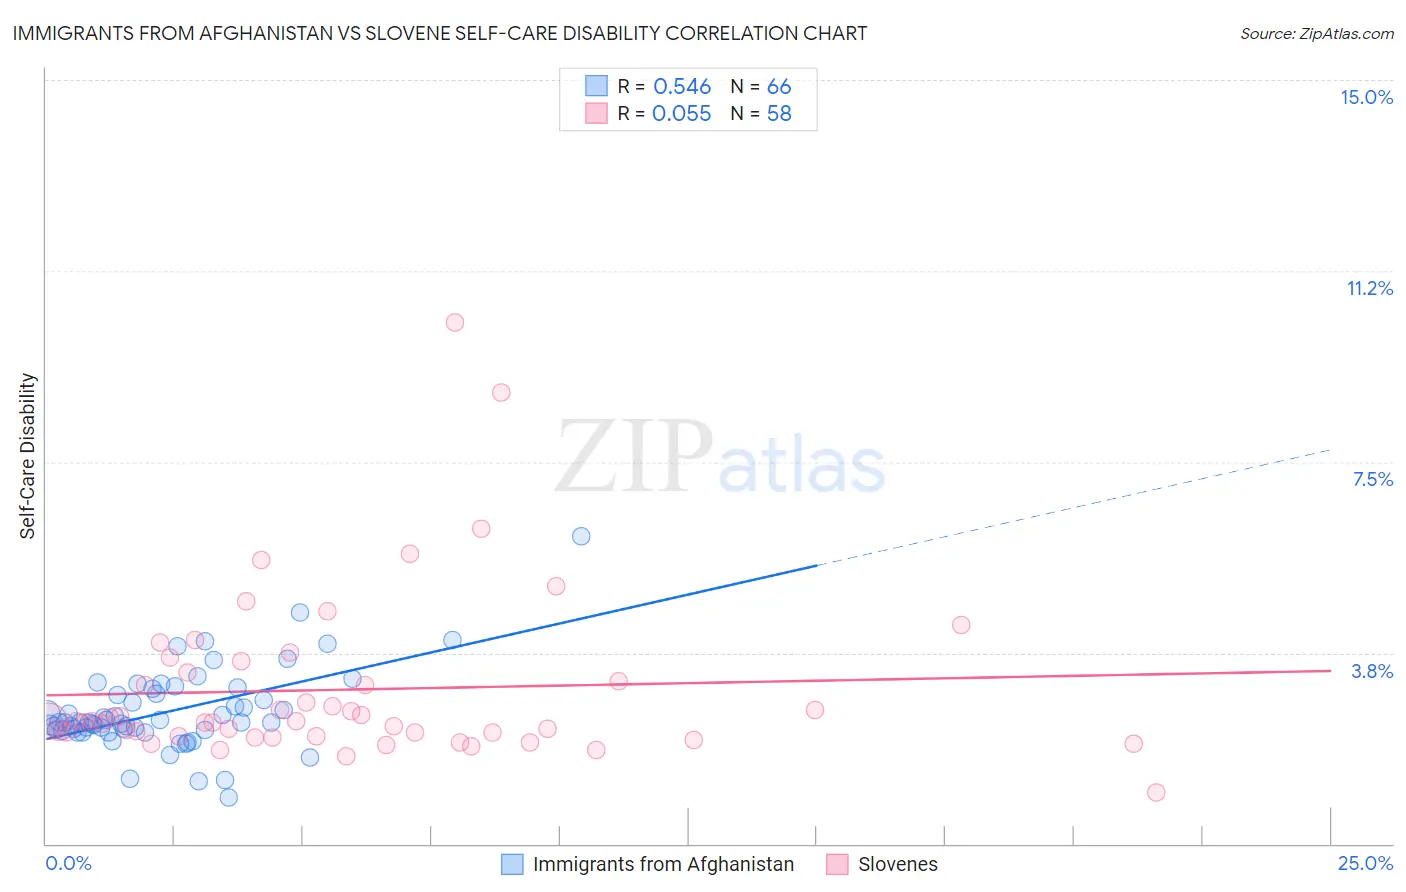
Immigrants from Afghanistan vs Slovene Self-Care Disability Correlation Chart

The statistical analysis conducted on geographies consisting of 147,580,725 people shows a substantial positive correlation between the proportion of Immigrants from Afghanistan and percentage of population with self-care disability in the United States with a correlation coefficient (R) of 0.546 and weighted average of 2.5%. Similarly, the statistical analysis conducted on geographies consisting of 261,131,209 people shows a slight positive correlation between the proportion of Slovenes and percentage of population with self-care disability in the United States with a correlation coefficient (R) of 0.055 and weighted average of 2.4%, a difference of 3.5%.
Immigrants from Afghanistan vs Slovene Self-Care Disability

Self-Care Disability Correlation Summary

MeasurementImmigrants from AfghanistanSlovene
Minimum0.91%1.00%
Maximum6.0%10.2%
Range5.1%9.2%
Mean2.6%3.0%
Median2.4%2.4%
Interquartile 25% (IQ1)2.2%2.1%
Interquartile 75% (IQ3)2.9%3.4%
Interquartile Range (IQR)0.71%1.2%
Standard Deviation (Sample)0.80%1.6%
Standard Deviation (Population)0.80%1.6%

Similar Demographics by Self-Care Disability

Demographics Similar to Immigrants from Afghanistan by Self-Care Disability

In terms of self-care disability, the demographic groups most similar to Immigrants from Afghanistan are Immigrants from Kazakhstan (2.5%, a difference of 0.040%), English (2.5%, a difference of 0.070%), Immigrants from Bosnia and Herzegovina (2.5%, a difference of 0.090%), Hungarian (2.5%, a difference of 0.10%), and Welsh (2.5%, a difference of 0.11%).
DemographicsRating | RankSelf-Care Disability
Immigrants | Somalia
55.9
/100
|
#169
Average
2.5%
Scottish
54.3
/100
|
#170
Average
2.5%
Pennsylvania Germans
53.5
/100
|
#171
Average
2.5%
Czechoslovakians
53.5
/100
|
#172
Average
2.5%
Immigrants | Burma/Myanmar
52.8
/100
|
#173
Average
2.5%
Welsh
50.0
/100
|
#174
Average
2.5%
Immigrants | Bosnia and Herzegovina
49.6
/100
|
#175
Average
2.5%
Immigrants | Afghanistan
47.6
/100
|
#176
Average
2.5%
Immigrants | Kazakhstan
46.7
/100
|
#177
Average
2.5%
English
46.2
/100
|
#178
Average
2.5%
Hungarians
45.5
/100
|
#179
Average
2.5%
Indonesians
41.2
/100
|
#180
Average
2.5%
Ghanaians
40.4
/100
|
#181
Average
2.5%
Maltese
37.5
/100
|
#182
Fair
2.5%
Salvadorans
36.4
/100
|
#183
Fair
2.5%

Demographics Similar to Slovenes by Self-Care Disability

In terms of self-care disability, the demographic groups most similar to Slovenes are Greek (2.4%, a difference of 0.010%), British (2.4%, a difference of 0.040%), Immigrants from Indonesia (2.4%, a difference of 0.050%), Carpatho Rusyn (2.4%, a difference of 0.060%), and Immigrants from Africa (2.4%, a difference of 0.080%).
DemographicsRating | RankSelf-Care Disability
Croatians
95.0
/100
|
#102
Exceptional
2.4%
Alsatians
94.9
/100
|
#103
Exceptional
2.4%
Bhutanese
94.5
/100
|
#104
Exceptional
2.4%
Carpatho Rusyns
94.4
/100
|
#105
Exceptional
2.4%
Immigrants | Indonesia
94.3
/100
|
#106
Exceptional
2.4%
British
94.3
/100
|
#107
Exceptional
2.4%
Greeks
94.1
/100
|
#108
Exceptional
2.4%
Slovenes
94.1
/100
|
#109
Exceptional
2.4%
Immigrants | Africa
93.7
/100
|
#110
Exceptional
2.4%
Serbians
93.6
/100
|
#111
Exceptional
2.4%
Scandinavians
93.5
/100
|
#112
Exceptional
2.4%
South Americans
93.2
/100
|
#113
Exceptional
2.4%
Immigrants | North Macedonia
93.1
/100
|
#114
Exceptional
2.4%
Immigrants | Hong Kong
93.1
/100
|
#115
Exceptional
2.4%
Northern Europeans
92.9
/100
|
#116
Exceptional
2.4%