Immigrants from Afghanistan vs Cambodian Self-Care Disability
COMPARE
Immigrants from Afghanistan
Cambodian
Self-Care Disability
Self-Care Disability Comparison
Immigrants from Afghanistan
Cambodians
2.5%
SELF-CARE DISABILITY
47.6/ 100
METRIC RATING
176th/ 347
METRIC RANK
2.2%
SELF-CARE DISABILITY
100.0/ 100
METRIC RATING
23rd/ 347
METRIC RANK
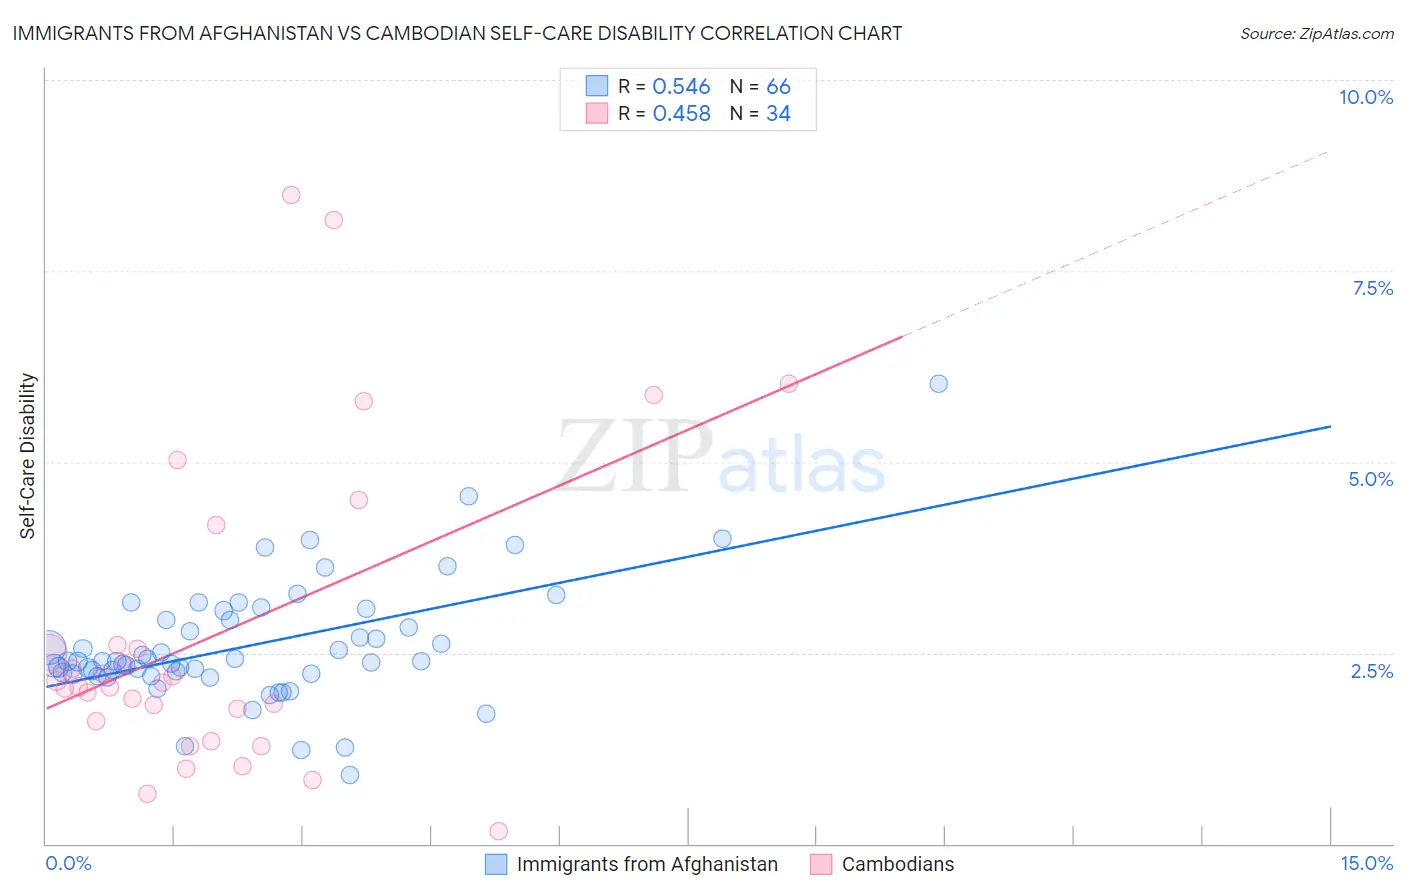
Immigrants from Afghanistan vs Cambodian Self-Care Disability Correlation Chart
The statistical analysis conducted on geographies consisting of 147,580,725 people shows a substantial positive correlation between the proportion of Immigrants from Afghanistan and percentage of population with self-care disability in the United States with a correlation coefficient (R) of 0.546 and weighted average of 2.5%. Similarly, the statistical analysis conducted on geographies consisting of 102,460,222 people shows a moderate positive correlation between the proportion of Cambodians and percentage of population with self-care disability in the United States with a correlation coefficient (R) of 0.458 and weighted average of 2.2%, a difference of 10.5%.
Self-Care Disability Correlation Summary
| Measurement | Immigrants from Afghanistan | Cambodian |
| Minimum | 0.91% | 0.17% |
| Maximum | 6.0% | 8.5% |
| Range | 5.1% | 8.3% |
| Mean | 2.6% | 2.8% |
| Median | 2.4% | 2.1% |
| Interquartile 25% (IQ1) | 2.2% | 1.6% |
| Interquartile 75% (IQ3) | 2.9% | 2.6% |
| Interquartile Range (IQR) | 0.71% | 1.00% |
| Standard Deviation (Sample) | 0.80% | 2.0% |
| Standard Deviation (Population) | 0.80% | 2.0% |
Similar Demographics by Self-Care Disability
Demographics Similar to Immigrants from Afghanistan by Self-Care Disability
In terms of self-care disability, the demographic groups most similar to Immigrants from Afghanistan are Immigrants from Kazakhstan (2.5%, a difference of 0.040%), English (2.5%, a difference of 0.070%), Immigrants from Bosnia and Herzegovina (2.5%, a difference of 0.090%), Hungarian (2.5%, a difference of 0.10%), and Welsh (2.5%, a difference of 0.11%).
| Demographics | Rating | Rank | Self-Care Disability |
| Immigrants | Somalia | 55.9 /100 | #169 | Average 2.5% |
| Scottish | 54.3 /100 | #170 | Average 2.5% |
| Pennsylvania Germans | 53.5 /100 | #171 | Average 2.5% |
| Czechoslovakians | 53.5 /100 | #172 | Average 2.5% |
| Immigrants | Burma/Myanmar | 52.8 /100 | #173 | Average 2.5% |
| Welsh | 50.0 /100 | #174 | Average 2.5% |
| Immigrants | Bosnia and Herzegovina | 49.6 /100 | #175 | Average 2.5% |
| Immigrants | Afghanistan | 47.6 /100 | #176 | Average 2.5% |
| Immigrants | Kazakhstan | 46.7 /100 | #177 | Average 2.5% |
| English | 46.2 /100 | #178 | Average 2.5% |
| Hungarians | 45.5 /100 | #179 | Average 2.5% |
| Indonesians | 41.2 /100 | #180 | Average 2.5% |
| Ghanaians | 40.4 /100 | #181 | Average 2.5% |
| Maltese | 37.5 /100 | #182 | Fair 2.5% |
| Salvadorans | 36.4 /100 | #183 | Fair 2.5% |
Demographics Similar to Cambodians by Self-Care Disability
In terms of self-care disability, the demographic groups most similar to Cambodians are Immigrants from Venezuela (2.2%, a difference of 0.21%), Bulgarian (2.2%, a difference of 0.25%), Cypriot (2.2%, a difference of 0.30%), Turkish (2.2%, a difference of 0.41%), and Immigrants from Sri Lanka (2.2%, a difference of 0.48%).
| Demographics | Rating | Rank | Self-Care Disability |
| Immigrants | Kuwait | 100.0 /100 | #16 | Exceptional 2.2% |
| Immigrants | Saudi Arabia | 100.0 /100 | #17 | Exceptional 2.2% |
| Immigrants | Taiwan | 100.0 /100 | #18 | Exceptional 2.2% |
| Immigrants | Eritrea | 100.0 /100 | #19 | Exceptional 2.2% |
| Tongans | 100.0 /100 | #20 | Exceptional 2.2% |
| Bulgarians | 100.0 /100 | #21 | Exceptional 2.2% |
| Immigrants | Venezuela | 100.0 /100 | #22 | Exceptional 2.2% |
| Cambodians | 100.0 /100 | #23 | Exceptional 2.2% |
| Cypriots | 100.0 /100 | #24 | Exceptional 2.2% |
| Turks | 100.0 /100 | #25 | Exceptional 2.2% |
| Immigrants | Sri Lanka | 99.9 /100 | #26 | Exceptional 2.2% |
| Venezuelans | 99.9 /100 | #27 | Exceptional 2.2% |
| Inupiat | 99.9 /100 | #28 | Exceptional 2.2% |
| Immigrants | Zimbabwe | 99.9 /100 | #29 | Exceptional 2.3% |
| Paraguayans | 99.9 /100 | #30 | Exceptional 2.3% |