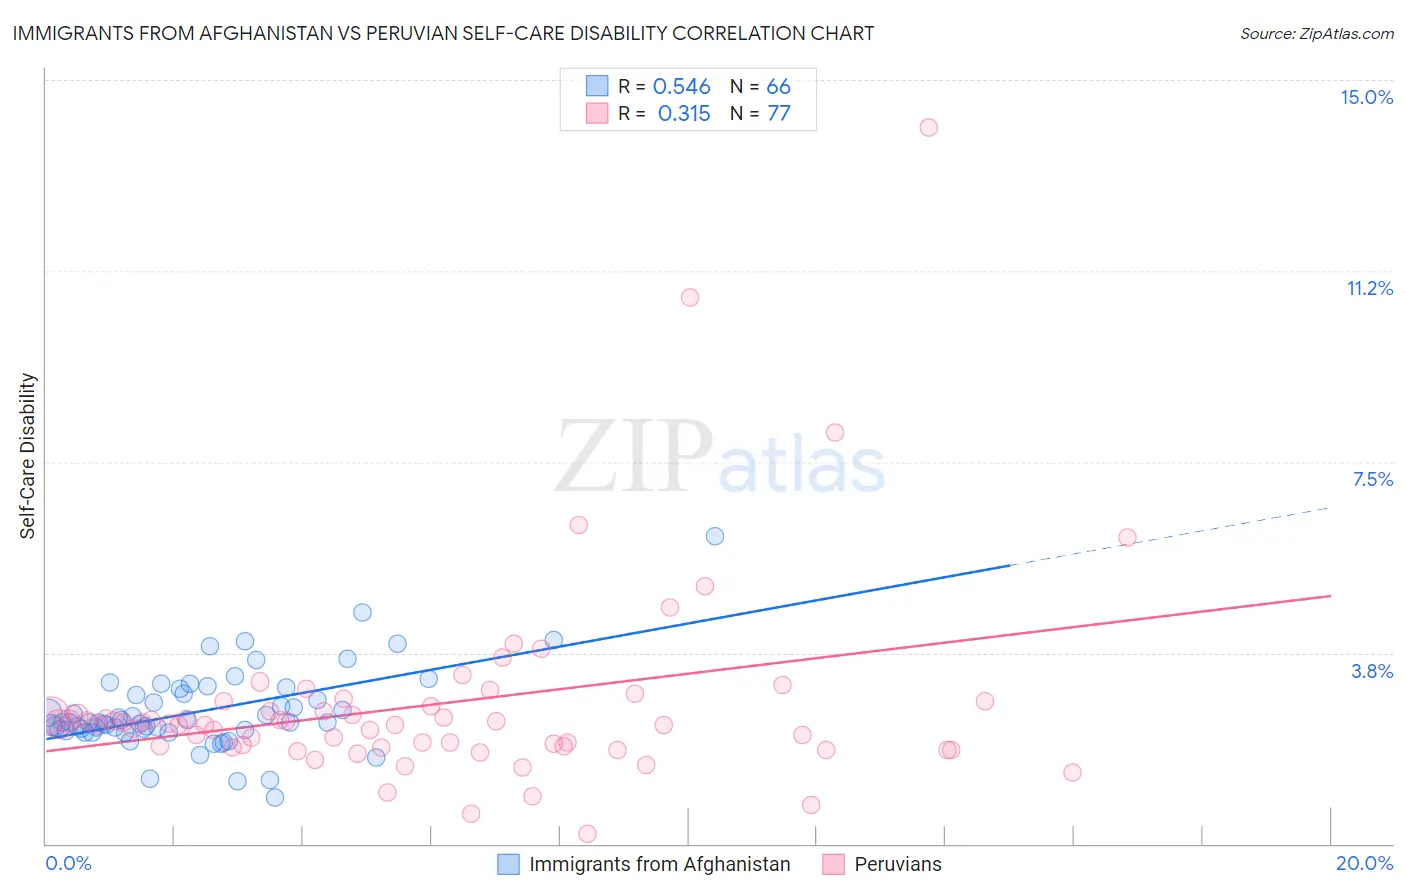
Immigrants from Afghanistan vs Peruvian Self-Care Disability
COMPARE
Immigrants from Afghanistan
Peruvian
Self-Care Disability
Self-Care Disability Comparison
Immigrants from Afghanistan
Peruvians
2.5%
SELF-CARE DISABILITY
47.6/ 100
METRIC RATING
176th/ 347
METRIC RANK
2.4%
SELF-CARE DISABILITY
91.3/ 100
METRIC RATING
121st/ 347
METRIC RANK
Immigrants from Afghanistan vs Peruvian Self-Care Disability Correlation Chart
The statistical analysis conducted on geographies consisting of 147,580,725 people shows a substantial positive correlation between the proportion of Immigrants from Afghanistan and percentage of population with self-care disability in the United States with a correlation coefficient (R) of 0.546 and weighted average of 2.5%. Similarly, the statistical analysis conducted on geographies consisting of 362,873,301 people shows a mild positive correlation between the proportion of Peruvians and percentage of population with self-care disability in the United States with a correlation coefficient (R) of 0.315 and weighted average of 2.4%, a difference of 3.0%.
Self-Care Disability Correlation Summary
| Measurement | Immigrants from Afghanistan | Peruvian |
| Minimum | 0.91% | 0.20% |
| Maximum | 6.0% | 14.1% |
| Range | 5.1% | 13.9% |
| Mean | 2.6% | 2.7% |
| Median | 2.4% | 2.3% |
| Interquartile 25% (IQ1) | 2.2% | 1.9% |
| Interquartile 75% (IQ3) | 2.9% | 2.8% |
| Interquartile Range (IQR) | 0.71% | 0.86% |
| Standard Deviation (Sample) | 0.80% | 2.0% |
| Standard Deviation (Population) | 0.80% | 2.0% |
Similar Demographics by Self-Care Disability
Demographics Similar to Immigrants from Afghanistan by Self-Care Disability
In terms of self-care disability, the demographic groups most similar to Immigrants from Afghanistan are Immigrants from Kazakhstan (2.5%, a difference of 0.040%), English (2.5%, a difference of 0.070%), Immigrants from Bosnia and Herzegovina (2.5%, a difference of 0.090%), Hungarian (2.5%, a difference of 0.10%), and Welsh (2.5%, a difference of 0.11%).
| Demographics | Rating | Rank | Self-Care Disability |
| Immigrants | Somalia | 55.9 /100 | #169 | Average 2.5% |
| Scottish | 54.3 /100 | #170 | Average 2.5% |
| Pennsylvania Germans | 53.5 /100 | #171 | Average 2.5% |
| Czechoslovakians | 53.5 /100 | #172 | Average 2.5% |
| Immigrants | Burma/Myanmar | 52.8 /100 | #173 | Average 2.5% |
| Welsh | 50.0 /100 | #174 | Average 2.5% |
| Immigrants | Bosnia and Herzegovina | 49.6 /100 | #175 | Average 2.5% |
| Immigrants | Afghanistan | 47.6 /100 | #176 | Average 2.5% |
| Immigrants | Kazakhstan | 46.7 /100 | #177 | Average 2.5% |
| English | 46.2 /100 | #178 | Average 2.5% |
| Hungarians | 45.5 /100 | #179 | Average 2.5% |
| Indonesians | 41.2 /100 | #180 | Average 2.5% |
| Ghanaians | 40.4 /100 | #181 | Average 2.5% |
| Maltese | 37.5 /100 | #182 | Fair 2.5% |
| Salvadorans | 36.4 /100 | #183 | Fair 2.5% |
Demographics Similar to Peruvians by Self-Care Disability
In terms of self-care disability, the demographic groups most similar to Peruvians are Uruguayan (2.4%, a difference of 0.030%), Immigrants from Sierra Leone (2.4%, a difference of 0.070%), Belgian (2.4%, a difference of 0.070%), Immigrants from Canada (2.4%, a difference of 0.11%), and Immigrants from Nigeria (2.4%, a difference of 0.15%).
| Demographics | Rating | Rank | Self-Care Disability |
| Immigrants | North Macedonia | 93.1 /100 | #114 | Exceptional 2.4% |
| Immigrants | Hong Kong | 93.1 /100 | #115 | Exceptional 2.4% |
| Northern Europeans | 92.9 /100 | #116 | Exceptional 2.4% |
| Taiwanese | 92.5 /100 | #117 | Exceptional 2.4% |
| Immigrants | Canada | 92.0 /100 | #118 | Exceptional 2.4% |
| Immigrants | Sierra Leone | 91.8 /100 | #119 | Exceptional 2.4% |
| Uruguayans | 91.5 /100 | #120 | Exceptional 2.4% |
| Peruvians | 91.3 /100 | #121 | Exceptional 2.4% |
| Belgians | 90.9 /100 | #122 | Exceptional 2.4% |
| Immigrants | Nigeria | 90.3 /100 | #123 | Exceptional 2.4% |
| Immigrants | North America | 90.2 /100 | #124 | Exceptional 2.4% |
| Immigrants | Morocco | 90.2 /100 | #124 | Exceptional 2.4% |
| Hmong | 89.9 /100 | #126 | Excellent 2.4% |
| Colombians | 89.7 /100 | #127 | Excellent 2.4% |
| Immigrants | Hungary | 89.6 /100 | #128 | Excellent 2.4% |