Hungarian vs Immigrants from Colombia Female Poverty Among 18-24 Year Olds
COMPARE
Hungarian
Immigrants from Colombia
Female Poverty Among 18-24 Year Olds
Female Poverty Among 18-24 Year Olds Comparison
Hungarians
Immigrants from Colombia
19.8%
FEMALE POVERTY AMONG 18-24 YEAR OLDS
76.6/ 100
METRIC RATING
155th/ 347
METRIC RANK
17.3%
FEMALE POVERTY AMONG 18-24 YEAR OLDS
100.0/ 100
METRIC RATING
18th/ 347
METRIC RANK
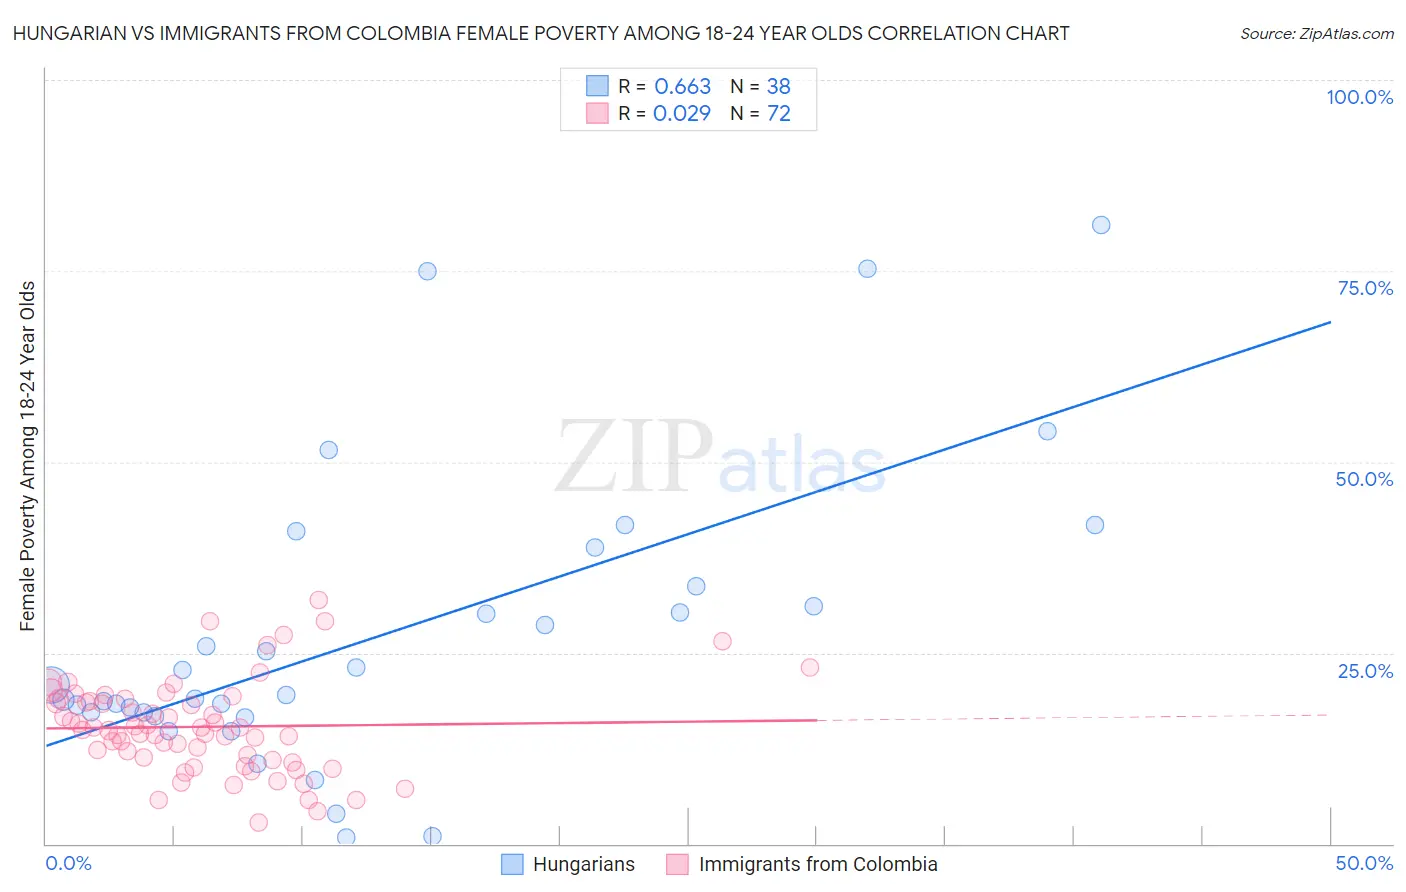
Hungarian vs Immigrants from Colombia Female Poverty Among 18-24 Year Olds Correlation Chart
The statistical analysis conducted on geographies consisting of 465,185,254 people shows a significant positive correlation between the proportion of Hungarians and poverty level among females between the ages 18 and 24 in the United States with a correlation coefficient (R) of 0.663 and weighted average of 19.8%. Similarly, the statistical analysis conducted on geographies consisting of 369,842,642 people shows no correlation between the proportion of Immigrants from Colombia and poverty level among females between the ages 18 and 24 in the United States with a correlation coefficient (R) of 0.029 and weighted average of 17.3%, a difference of 14.2%.
Female Poverty Among 18-24 Year Olds Correlation Summary
| Measurement | Hungarian | Immigrants from Colombia |
| Minimum | 0.77% | 2.8% |
| Maximum | 81.0% | 32.0% |
| Range | 80.3% | 29.2% |
| Mean | 27.4% | 15.3% |
| Median | 20.1% | 15.0% |
| Interquartile 25% (IQ1) | 17.1% | 11.2% |
| Interquartile 75% (IQ3) | 33.7% | 18.9% |
| Interquartile Range (IQR) | 16.5% | 7.7% |
| Standard Deviation (Sample) | 19.2% | 6.0% |
| Standard Deviation (Population) | 18.9% | 6.0% |
Similar Demographics by Female Poverty Among 18-24 Year Olds
Demographics Similar to Hungarians by Female Poverty Among 18-24 Year Olds
In terms of female poverty among 18-24 year olds, the demographic groups most similar to Hungarians are Immigrants from Zimbabwe (19.8%, a difference of 0.0%), Immigrants from Belgium (19.8%, a difference of 0.010%), Danish (19.8%, a difference of 0.070%), Immigrants from Lebanon (19.8%, a difference of 0.090%), and Immigrants from Japan (19.8%, a difference of 0.11%).
| Demographics | Rating | Rank | Female Poverty Among 18-24 Year Olds |
| Immigrants | Latin America | 81.3 /100 | #148 | Excellent 19.7% |
| Immigrants | Oceania | 81.2 /100 | #149 | Excellent 19.7% |
| Syrians | 80.2 /100 | #150 | Excellent 19.8% |
| Immigrants | Eastern Asia | 79.7 /100 | #151 | Good 19.8% |
| Yugoslavians | 79.0 /100 | #152 | Good 19.8% |
| Immigrants | Japan | 78.1 /100 | #153 | Good 19.8% |
| Immigrants | Zimbabwe | 76.7 /100 | #154 | Good 19.8% |
| Hungarians | 76.6 /100 | #155 | Good 19.8% |
| Immigrants | Belgium | 76.4 /100 | #156 | Good 19.8% |
| Danes | 75.5 /100 | #157 | Good 19.8% |
| Immigrants | Lebanon | 75.3 /100 | #158 | Good 19.8% |
| Trinidadians and Tobagonians | 74.4 /100 | #159 | Good 19.8% |
| Pakistanis | 74.1 /100 | #160 | Good 19.8% |
| Immigrants | Belize | 74.1 /100 | #161 | Good 19.8% |
| French Canadians | 73.0 /100 | #162 | Good 19.9% |
Demographics Similar to Immigrants from Colombia by Female Poverty Among 18-24 Year Olds
In terms of female poverty among 18-24 year olds, the demographic groups most similar to Immigrants from Colombia are Immigrants from Lithuania (17.4%, a difference of 0.41%), Immigrants from Taiwan (17.3%, a difference of 0.46%), Immigrants from Venezuela (17.4%, a difference of 0.54%), Bolivian (17.4%, a difference of 0.54%), and Immigrants from Hong Kong (17.5%, a difference of 0.64%).
| Demographics | Rating | Rank | Female Poverty Among 18-24 Year Olds |
| Thais | 100.0 /100 | #11 | Exceptional 17.0% |
| Immigrants | Pakistan | 100.0 /100 | #12 | Exceptional 17.0% |
| Immigrants | Poland | 100.0 /100 | #13 | Exceptional 17.1% |
| Tongans | 100.0 /100 | #14 | Exceptional 17.1% |
| Cubans | 100.0 /100 | #15 | Exceptional 17.2% |
| Peruvians | 100.0 /100 | #16 | Exceptional 17.2% |
| Immigrants | Taiwan | 100.0 /100 | #17 | Exceptional 17.3% |
| Immigrants | Colombia | 100.0 /100 | #18 | Exceptional 17.3% |
| Immigrants | Lithuania | 100.0 /100 | #19 | Exceptional 17.4% |
| Immigrants | Venezuela | 100.0 /100 | #20 | Exceptional 17.4% |
| Bolivians | 100.0 /100 | #21 | Exceptional 17.4% |
| Immigrants | Hong Kong | 100.0 /100 | #22 | Exceptional 17.5% |
| Immigrants | North Macedonia | 100.0 /100 | #23 | Exceptional 17.6% |
| Maltese | 100.0 /100 | #24 | Exceptional 17.6% |
| Immigrants | South Central Asia | 100.0 /100 | #25 | Exceptional 17.6% |