Immigrants from Sudan vs Immigrants from Colombia Ambulatory Disability
COMPARE
Immigrants from Sudan
Immigrants from Colombia
Ambulatory Disability
Ambulatory Disability Comparison
Immigrants from Sudan
Immigrants from Colombia
5.8%
AMBULATORY DISABILITY
98.8/ 100
METRIC RATING
91st/ 347
METRIC RANK
5.8%
AMBULATORY DISABILITY
96.7/ 100
METRIC RATING
110th/ 347
METRIC RANK
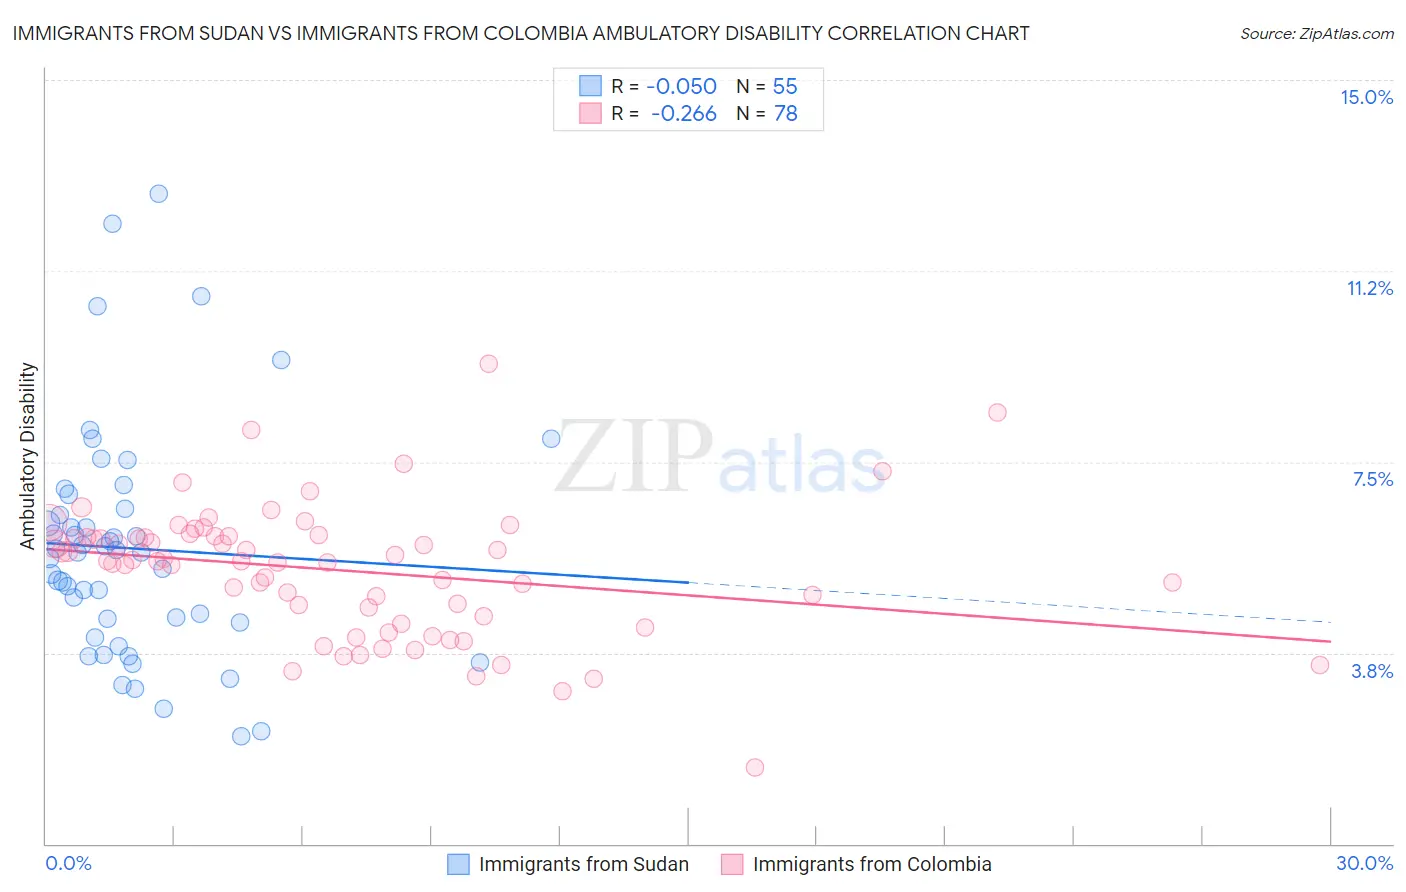
Immigrants from Sudan vs Immigrants from Colombia Ambulatory Disability Correlation Chart
The statistical analysis conducted on geographies consisting of 118,955,409 people shows a slight negative correlation between the proportion of Immigrants from Sudan and percentage of population with ambulatory disability in the United States with a correlation coefficient (R) of -0.050 and weighted average of 5.8%. Similarly, the statistical analysis conducted on geographies consisting of 378,592,310 people shows a weak negative correlation between the proportion of Immigrants from Colombia and percentage of population with ambulatory disability in the United States with a correlation coefficient (R) of -0.266 and weighted average of 5.8%, a difference of 1.4%.
Ambulatory Disability Correlation Summary
| Measurement | Immigrants from Sudan | Immigrants from Colombia |
| Minimum | 2.1% | 1.5% |
| Maximum | 12.8% | 9.4% |
| Range | 10.7% | 7.9% |
| Mean | 5.8% | 5.4% |
| Median | 5.7% | 5.6% |
| Interquartile 25% (IQ1) | 4.3% | 4.5% |
| Interquartile 75% (IQ3) | 6.6% | 6.0% |
| Interquartile Range (IQR) | 2.2% | 1.6% |
| Standard Deviation (Sample) | 2.3% | 1.3% |
| Standard Deviation (Population) | 2.2% | 1.3% |
Demographics Similar to Immigrants from Sudan and Immigrants from Colombia by Ambulatory Disability
In terms of ambulatory disability, the demographic groups most similar to Immigrants from Sudan are Australian (5.8%, a difference of 0.0%), Immigrants from Sierra Leone (5.8%, a difference of 0.17%), Immigrants from Denmark (5.8%, a difference of 0.17%), Kenyan (5.8%, a difference of 0.37%), and Immigrants from El Salvador (5.8%, a difference of 0.40%). Similarly, the demographic groups most similar to Immigrants from Colombia are Immigrants from Netherlands (5.8%, a difference of 0.18%), Colombian (5.8%, a difference of 0.19%), Uruguayan (5.8%, a difference of 0.21%), Immigrants from Morocco (5.8%, a difference of 0.26%), and Immigrants from Czechoslovakia (5.8%, a difference of 0.33%).
| Demographics | Rating | Rank | Ambulatory Disability |
| Australians | 98.8 /100 | #90 | Exceptional 5.8% |
| Immigrants | Sudan | 98.8 /100 | #91 | Exceptional 5.8% |
| Immigrants | Sierra Leone | 98.6 /100 | #92 | Exceptional 5.8% |
| Immigrants | Denmark | 98.6 /100 | #93 | Exceptional 5.8% |
| Kenyans | 98.4 /100 | #94 | Exceptional 5.8% |
| Immigrants | El Salvador | 98.4 /100 | #95 | Exceptional 5.8% |
| Salvadorans | 98.4 /100 | #96 | Exceptional 5.8% |
| Immigrants | Somalia | 98.3 /100 | #97 | Exceptional 5.8% |
| Immigrants | Lebanon | 98.3 /100 | #98 | Exceptional 5.8% |
| Immigrants | Northern Europe | 98.2 /100 | #99 | Exceptional 5.8% |
| Immigrants | Serbia | 97.9 /100 | #100 | Exceptional 5.8% |
| Immigrants | South America | 97.9 /100 | #101 | Exceptional 5.8% |
| Immigrants | Kenya | 97.8 /100 | #102 | Exceptional 5.8% |
| Immigrants | Romania | 97.7 /100 | #103 | Exceptional 5.8% |
| New Zealanders | 97.6 /100 | #104 | Exceptional 5.8% |
| Immigrants | Czechoslovakia | 97.4 /100 | #105 | Exceptional 5.8% |
| Immigrants | Morocco | 97.3 /100 | #106 | Exceptional 5.8% |
| Uruguayans | 97.2 /100 | #107 | Exceptional 5.8% |
| Colombians | 97.2 /100 | #108 | Exceptional 5.8% |
| Immigrants | Netherlands | 97.1 /100 | #109 | Exceptional 5.8% |
| Immigrants | Colombia | 96.7 /100 | #110 | Exceptional 5.8% |