Tohono O'odham vs Immigrants from Colombia Ambulatory Disability
COMPARE
Tohono O'odham
Immigrants from Colombia
Ambulatory Disability
Ambulatory Disability Comparison
Tohono O'odham
Immigrants from Colombia
8.7%
AMBULATORY DISABILITY
0.0/ 100
METRIC RATING
343rd/ 347
METRIC RANK
5.8%
AMBULATORY DISABILITY
96.7/ 100
METRIC RATING
110th/ 347
METRIC RANK
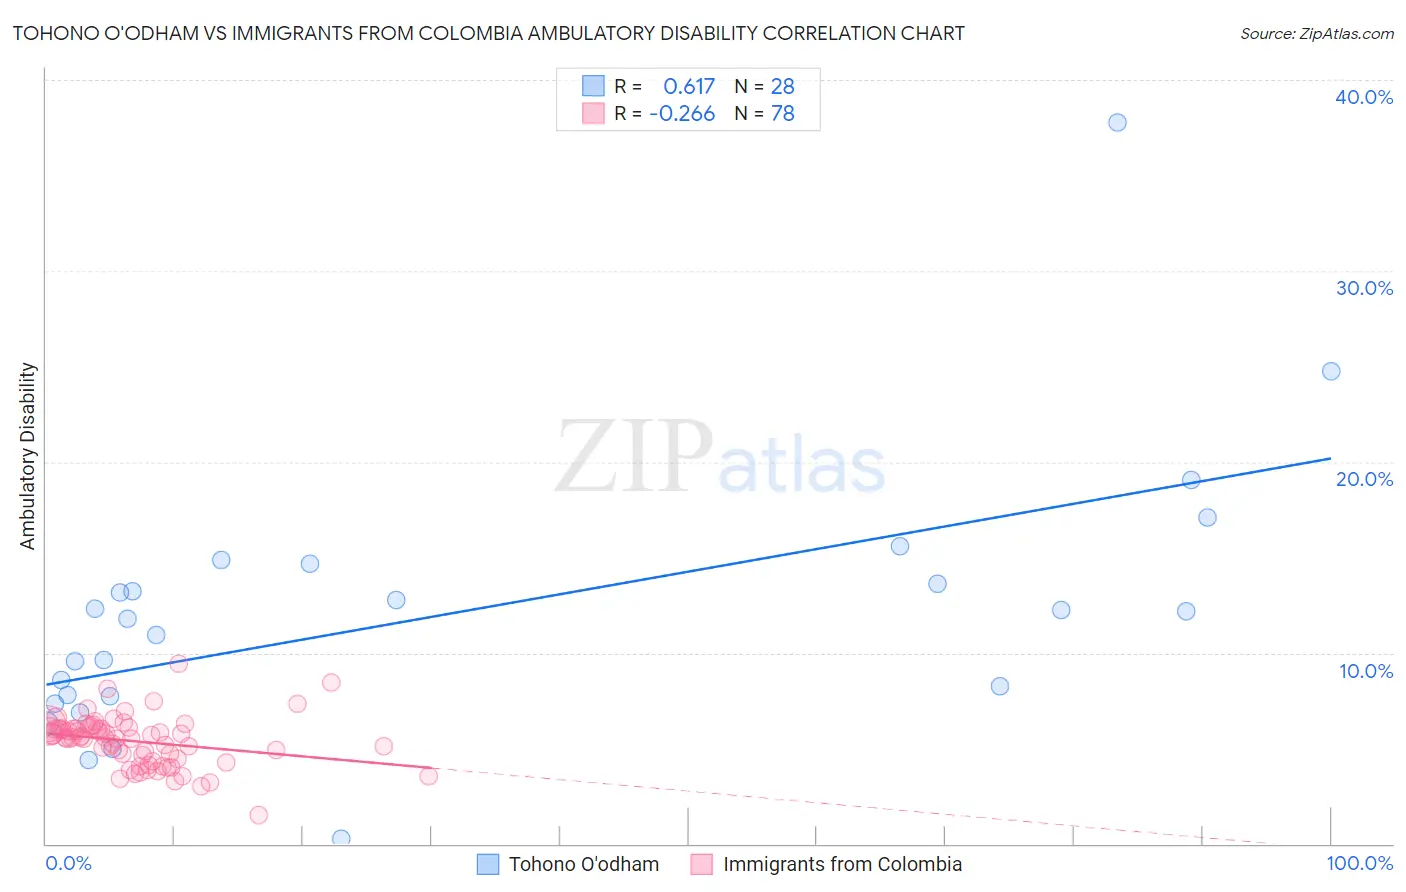
Tohono O'odham vs Immigrants from Colombia Ambulatory Disability Correlation Chart
The statistical analysis conducted on geographies consisting of 58,714,537 people shows a significant positive correlation between the proportion of Tohono O'odham and percentage of population with ambulatory disability in the United States with a correlation coefficient (R) of 0.617 and weighted average of 8.7%. Similarly, the statistical analysis conducted on geographies consisting of 378,592,310 people shows a weak negative correlation between the proportion of Immigrants from Colombia and percentage of population with ambulatory disability in the United States with a correlation coefficient (R) of -0.266 and weighted average of 5.8%, a difference of 49.5%.
Ambulatory Disability Correlation Summary
| Measurement | Tohono O'odham | Immigrants from Colombia |
| Minimum | 0.26% | 1.5% |
| Maximum | 37.8% | 9.4% |
| Range | 37.5% | 7.9% |
| Mean | 12.1% | 5.4% |
| Median | 12.0% | 5.6% |
| Interquartile 25% (IQ1) | 7.8% | 4.5% |
| Interquartile 75% (IQ3) | 14.2% | 6.0% |
| Interquartile Range (IQR) | 6.4% | 1.6% |
| Standard Deviation (Sample) | 7.0% | 1.3% |
| Standard Deviation (Population) | 6.9% | 1.3% |
Similar Demographics by Ambulatory Disability
Demographics Similar to Tohono O'odham by Ambulatory Disability
In terms of ambulatory disability, the demographic groups most similar to Tohono O'odham are Tsimshian (8.8%, a difference of 0.97%), Kiowa (8.6%, a difference of 1.5%), Puerto Rican (8.9%, a difference of 1.6%), Creek (8.5%, a difference of 3.4%), and Choctaw (8.3%, a difference of 5.1%).
| Demographics | Rating | Rank | Ambulatory Disability |
| Cherokee | 0.0 /100 | #333 | Tragic 7.9% |
| Yuman | 0.0 /100 | #334 | Tragic 7.9% |
| Chickasaw | 0.0 /100 | #335 | Tragic 8.0% |
| Seminole | 0.0 /100 | #336 | Tragic 8.0% |
| Dutch West Indians | 0.0 /100 | #337 | Tragic 8.2% |
| Colville | 0.0 /100 | #338 | Tragic 8.2% |
| Pima | 0.0 /100 | #339 | Tragic 8.2% |
| Choctaw | 0.0 /100 | #340 | Tragic 8.3% |
| Creek | 0.0 /100 | #341 | Tragic 8.5% |
| Kiowa | 0.0 /100 | #342 | Tragic 8.6% |
| Tohono O'odham | 0.0 /100 | #343 | Tragic 8.7% |
| Tsimshian | 0.0 /100 | #344 | Tragic 8.8% |
| Puerto Ricans | 0.0 /100 | #345 | Tragic 8.9% |
| Houma | 0.0 /100 | #346 | Tragic 9.3% |
| Lumbee | 0.0 /100 | #347 | Tragic 9.5% |
Demographics Similar to Immigrants from Colombia by Ambulatory Disability
In terms of ambulatory disability, the demographic groups most similar to Immigrants from Colombia are Danish (5.8%, a difference of 0.070%), Immigrants from Netherlands (5.8%, a difference of 0.18%), Colombian (5.8%, a difference of 0.19%), South African (5.9%, a difference of 0.20%), and Uruguayan (5.8%, a difference of 0.21%).
| Demographics | Rating | Rank | Ambulatory Disability |
| Immigrants | Romania | 97.7 /100 | #103 | Exceptional 5.8% |
| New Zealanders | 97.6 /100 | #104 | Exceptional 5.8% |
| Immigrants | Czechoslovakia | 97.4 /100 | #105 | Exceptional 5.8% |
| Immigrants | Morocco | 97.3 /100 | #106 | Exceptional 5.8% |
| Uruguayans | 97.2 /100 | #107 | Exceptional 5.8% |
| Colombians | 97.2 /100 | #108 | Exceptional 5.8% |
| Immigrants | Netherlands | 97.1 /100 | #109 | Exceptional 5.8% |
| Immigrants | Colombia | 96.7 /100 | #110 | Exceptional 5.8% |
| Danes | 96.6 /100 | #111 | Exceptional 5.8% |
| South Africans | 96.3 /100 | #112 | Exceptional 5.9% |
| Immigrants | Uruguay | 95.6 /100 | #113 | Exceptional 5.9% |
| Immigrants | Poland | 95.4 /100 | #114 | Exceptional 5.9% |
| South American Indians | 94.8 /100 | #115 | Exceptional 5.9% |
| Immigrants | Africa | 94.7 /100 | #116 | Exceptional 5.9% |
| Immigrants | South Eastern Asia | 93.6 /100 | #117 | Exceptional 5.9% |