Immigrants from Indonesia vs Honduran Female Disability
COMPARE
Immigrants from Indonesia
Honduran
Female Disability
Female Disability Comparison
Immigrants from Indonesia
Hondurans
11.2%
FEMALE DISABILITY
100.0/ 100
METRIC RATING
34th/ 347
METRIC RANK
12.3%
FEMALE DISABILITY
25.4/ 100
METRIC RATING
197th/ 347
METRIC RANK
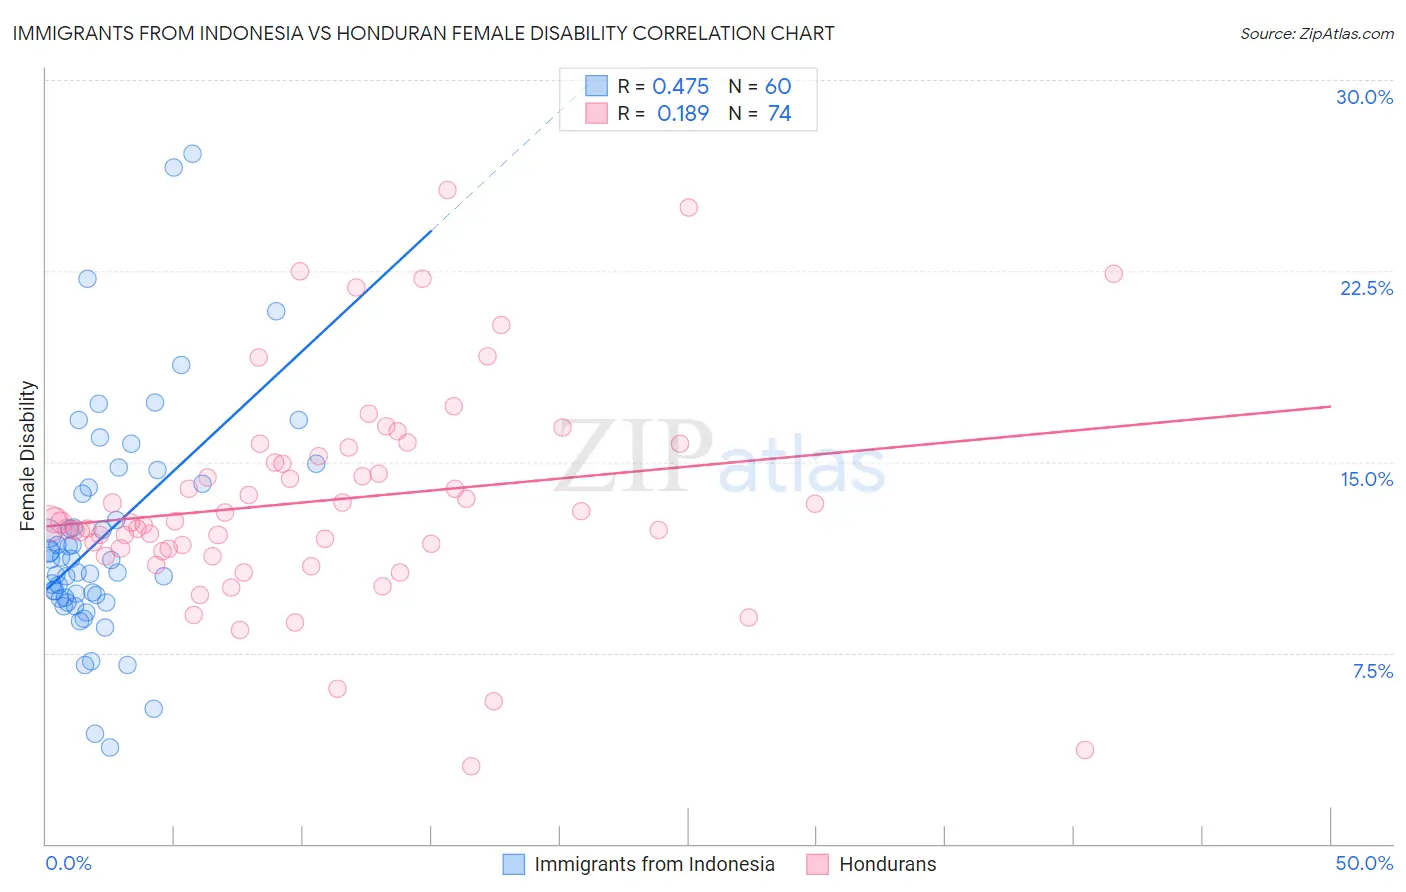
Immigrants from Indonesia vs Honduran Female Disability Correlation Chart
The statistical analysis conducted on geographies consisting of 215,789,523 people shows a moderate positive correlation between the proportion of Immigrants from Indonesia and percentage of females with a disability in the United States with a correlation coefficient (R) of 0.475 and weighted average of 11.2%. Similarly, the statistical analysis conducted on geographies consisting of 357,759,826 people shows a poor positive correlation between the proportion of Hondurans and percentage of females with a disability in the United States with a correlation coefficient (R) of 0.189 and weighted average of 12.3%, a difference of 10.3%.
Female Disability Correlation Summary
| Measurement | Immigrants from Indonesia | Honduran |
| Minimum | 3.8% | 3.1% |
| Maximum | 27.1% | 25.7% |
| Range | 23.3% | 22.6% |
| Mean | 12.1% | 13.5% |
| Median | 11.2% | 12.6% |
| Interquartile 25% (IQ1) | 9.7% | 11.6% |
| Interquartile 75% (IQ3) | 14.1% | 15.2% |
| Interquartile Range (IQR) | 4.4% | 3.6% |
| Standard Deviation (Sample) | 4.5% | 4.2% |
| Standard Deviation (Population) | 4.5% | 4.2% |
Similar Demographics by Female Disability
Demographics Similar to Immigrants from Indonesia by Female Disability
In terms of female disability, the demographic groups most similar to Immigrants from Indonesia are Immigrants from Japan (11.2%, a difference of 0.15%), Cypriot (11.2%, a difference of 0.21%), Ethiopian (11.2%, a difference of 0.22%), Immigrants from Egypt (11.1%, a difference of 0.25%), and Immigrants from Ethiopia (11.2%, a difference of 0.25%).
| Demographics | Rating | Rank | Female Disability |
| Immigrants | Turkey | 100.0 /100 | #27 | Exceptional 11.1% |
| Egyptians | 100.0 /100 | #28 | Exceptional 11.1% |
| Immigrants | Malaysia | 100.0 /100 | #29 | Exceptional 11.1% |
| Turks | 100.0 /100 | #30 | Exceptional 11.1% |
| Immigrants | Kuwait | 100.0 /100 | #31 | Exceptional 11.1% |
| Immigrants | Australia | 100.0 /100 | #32 | Exceptional 11.1% |
| Immigrants | Egypt | 100.0 /100 | #33 | Exceptional 11.1% |
| Immigrants | Indonesia | 100.0 /100 | #34 | Exceptional 11.2% |
| Immigrants | Japan | 100.0 /100 | #35 | Exceptional 11.2% |
| Cypriots | 100.0 /100 | #36 | Exceptional 11.2% |
| Ethiopians | 100.0 /100 | #37 | Exceptional 11.2% |
| Immigrants | Ethiopia | 100.0 /100 | #38 | Exceptional 11.2% |
| Immigrants | Lithuania | 100.0 /100 | #39 | Exceptional 11.2% |
| Mongolians | 100.0 /100 | #40 | Exceptional 11.2% |
| Paraguayans | 100.0 /100 | #41 | Exceptional 11.2% |
Demographics Similar to Hondurans by Female Disability
In terms of female disability, the demographic groups most similar to Hondurans are Immigrants from Panama (12.3%, a difference of 0.0%), Mexican American Indian (12.3%, a difference of 0.030%), Immigrants from Trinidad and Tobago (12.3%, a difference of 0.040%), Swedish (12.3%, a difference of 0.060%), and Ukrainian (12.3%, a difference of 0.080%).
| Demographics | Rating | Rank | Female Disability |
| Immigrants | Honduras | 31.3 /100 | #190 | Fair 12.3% |
| Armenians | 29.7 /100 | #191 | Fair 12.3% |
| Immigrants | Western Africa | 29.2 /100 | #192 | Fair 12.3% |
| Northern Europeans | 27.5 /100 | #193 | Fair 12.3% |
| Ukrainians | 27.2 /100 | #194 | Fair 12.3% |
| Swedes | 26.6 /100 | #195 | Fair 12.3% |
| Immigrants | Panama | 25.5 /100 | #196 | Fair 12.3% |
| Hondurans | 25.4 /100 | #197 | Fair 12.3% |
| Mexican American Indians | 24.9 /100 | #198 | Fair 12.3% |
| Immigrants | Trinidad and Tobago | 24.7 /100 | #199 | Fair 12.3% |
| Trinidadians and Tobagonians | 22.4 /100 | #200 | Fair 12.3% |
| Chinese | 22.1 /100 | #201 | Fair 12.3% |
| Somalis | 21.5 /100 | #202 | Fair 12.3% |
| Immigrants | Barbados | 21.1 /100 | #203 | Fair 12.3% |
| Immigrants | Zaire | 20.9 /100 | #204 | Fair 12.3% |