New Zealander vs Immigrants from Netherlands Disability Age Under 5
COMPARE
New Zealander
Immigrants from Netherlands
Disability Age Under 5
Disability Age Under 5 Comparison
New Zealanders
Immigrants from Netherlands
1.2%
DISABILITY AGE UNDER 5
81.4/ 100
METRIC RATING
139th/ 347
METRIC RANK
1.4%
DISABILITY AGE UNDER 5
0.2/ 100
METRIC RATING
261st/ 347
METRIC RANK
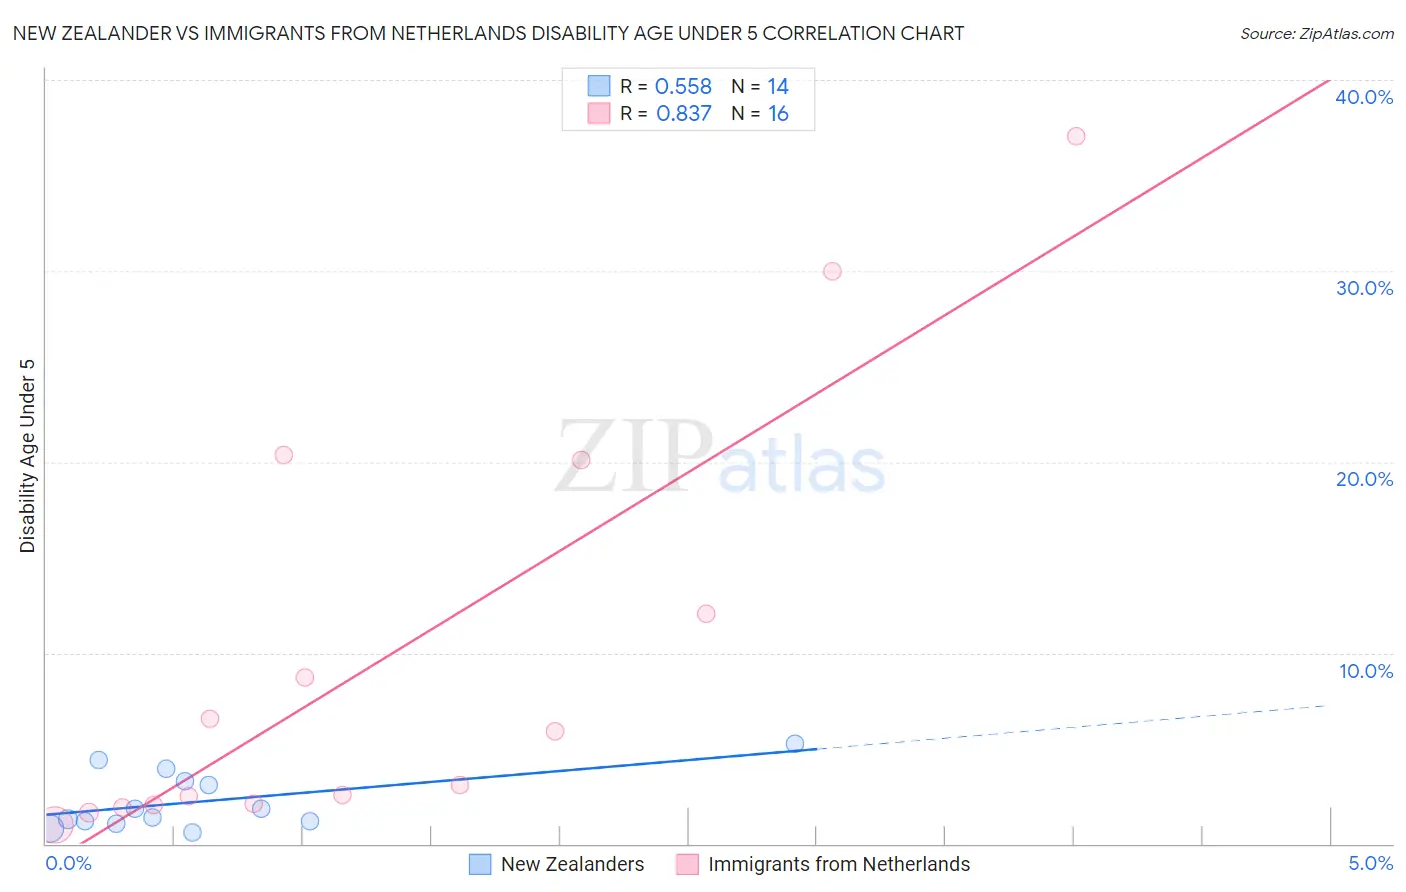
New Zealander vs Immigrants from Netherlands Disability Age Under 5 Correlation Chart
The statistical analysis conducted on geographies consisting of 80,962,050 people shows a substantial positive correlation between the proportion of New Zealanders and percentage of population with a disability under the age of 5 in the United States with a correlation coefficient (R) of 0.558 and weighted average of 1.2%. Similarly, the statistical analysis conducted on geographies consisting of 148,496,878 people shows a very strong positive correlation between the proportion of Immigrants from Netherlands and percentage of population with a disability under the age of 5 in the United States with a correlation coefficient (R) of 0.837 and weighted average of 1.4%, a difference of 18.2%.
Disability Age Under 5 Correlation Summary
| Measurement | New Zealander | Immigrants from Netherlands |
| Minimum | 0.60% | 0.96% |
| Maximum | 5.2% | 37.0% |
| Range | 4.6% | 36.1% |
| Mean | 2.2% | 9.8% |
| Median | 1.6% | 4.5% |
| Interquartile 25% (IQ1) | 1.2% | 2.1% |
| Interquartile 75% (IQ3) | 3.3% | 16.1% |
| Interquartile Range (IQR) | 2.1% | 14.0% |
| Standard Deviation (Sample) | 1.5% | 11.2% |
| Standard Deviation (Population) | 1.4% | 10.8% |
Similar Demographics by Disability Age Under 5
Demographics Similar to New Zealanders by Disability Age Under 5
In terms of disability age under 5, the demographic groups most similar to New Zealanders are Somali (1.2%, a difference of 0.090%), Immigrants from Honduras (1.2%, a difference of 0.15%), Immigrants from Czechoslovakia (1.2%, a difference of 0.23%), Immigrants from Eastern Africa (1.2%, a difference of 0.28%), and Immigrants from Colombia (1.2%, a difference of 0.31%).
| Demographics | Rating | Rank | Disability Age Under 5 |
| Immigrants | Eastern Europe | 87.3 /100 | #132 | Excellent 1.2% |
| Immigrants | Spain | 86.5 /100 | #133 | Excellent 1.2% |
| Argentineans | 85.7 /100 | #134 | Excellent 1.2% |
| Fijians | 84.7 /100 | #135 | Excellent 1.2% |
| Moroccans | 83.6 /100 | #136 | Excellent 1.2% |
| Immigrants | Eastern Africa | 83.1 /100 | #137 | Excellent 1.2% |
| Immigrants | Czechoslovakia | 82.8 /100 | #138 | Excellent 1.2% |
| New Zealanders | 81.4 /100 | #139 | Excellent 1.2% |
| Somalis | 80.8 /100 | #140 | Excellent 1.2% |
| Immigrants | Honduras | 80.4 /100 | #141 | Excellent 1.2% |
| Immigrants | Colombia | 79.3 /100 | #142 | Good 1.2% |
| Alsatians | 79.3 /100 | #143 | Good 1.2% |
| Immigrants | Middle Africa | 79.3 /100 | #144 | Good 1.2% |
| Immigrants | Zimbabwe | 77.9 /100 | #145 | Good 1.2% |
| Samoans | 77.7 /100 | #146 | Good 1.2% |
Demographics Similar to Immigrants from Netherlands by Disability Age Under 5
In terms of disability age under 5, the demographic groups most similar to Immigrants from Netherlands are Immigrants from Dominica (1.4%, a difference of 0.16%), Spanish (1.4%, a difference of 0.22%), Yugoslavian (1.4%, a difference of 0.37%), Carpatho Rusyn (1.4%, a difference of 0.41%), and Immigrants from Germany (1.4%, a difference of 0.44%).
| Demographics | Rating | Rank | Disability Age Under 5 |
| Immigrants | Brazil | 0.7 /100 | #254 | Tragic 1.4% |
| Immigrants | Liberia | 0.6 /100 | #255 | Tragic 1.4% |
| Immigrants | Western Europe | 0.5 /100 | #256 | Tragic 1.4% |
| Slovenes | 0.3 /100 | #257 | Tragic 1.4% |
| Costa Ricans | 0.3 /100 | #258 | Tragic 1.4% |
| Immigrants | Southern Europe | 0.3 /100 | #259 | Tragic 1.4% |
| Slavs | 0.3 /100 | #260 | Tragic 1.4% |
| Immigrants | Netherlands | 0.2 /100 | #261 | Tragic 1.4% |
| Immigrants | Dominica | 0.2 /100 | #262 | Tragic 1.4% |
| Spanish | 0.2 /100 | #263 | Tragic 1.4% |
| Yugoslavians | 0.1 /100 | #264 | Tragic 1.4% |
| Carpatho Rusyns | 0.1 /100 | #265 | Tragic 1.4% |
| Immigrants | Germany | 0.1 /100 | #266 | Tragic 1.4% |
| Cree | 0.1 /100 | #267 | Tragic 1.4% |
| Belgians | 0.1 /100 | #268 | Tragic 1.4% |