Dutch vs Arapaho Cognitive Disability
COMPARE
Dutch
Arapaho
Cognitive Disability
Cognitive Disability Comparison
Dutch
Arapaho
16.8%
COGNITIVE DISABILITY
98.5/ 100
METRIC RATING
97th/ 347
METRIC RANK
16.8%
COGNITIVE DISABILITY
97.3/ 100
METRIC RATING
110th/ 347
METRIC RANK
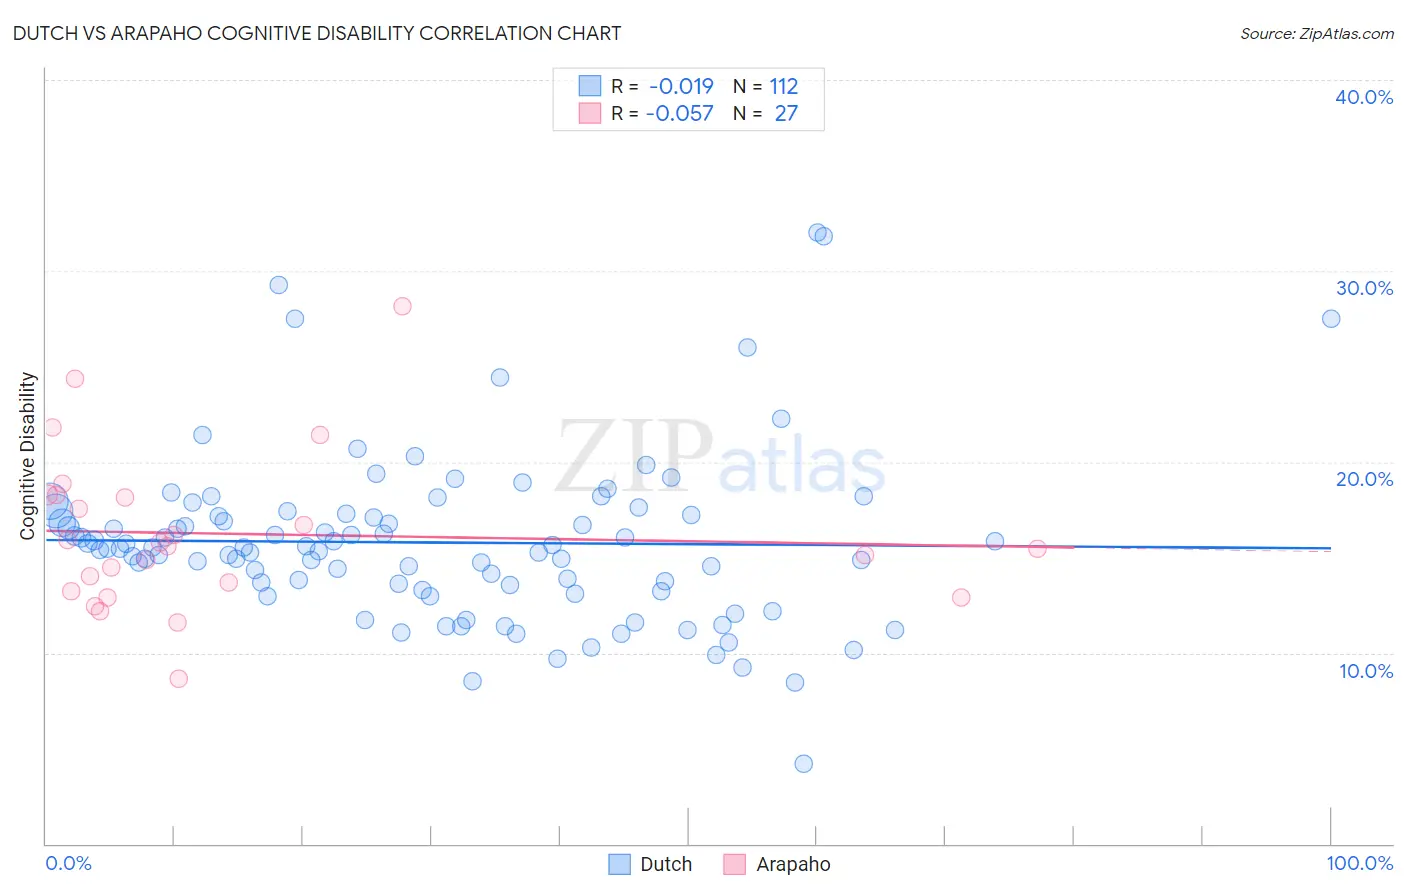
Dutch vs Arapaho Cognitive Disability Correlation Chart
The statistical analysis conducted on geographies consisting of 554,237,240 people shows no correlation between the proportion of Dutch and percentage of population with cognitive disability in the United States with a correlation coefficient (R) of -0.019 and weighted average of 16.8%. Similarly, the statistical analysis conducted on geographies consisting of 29,780,325 people shows a slight negative correlation between the proportion of Arapaho and percentage of population with cognitive disability in the United States with a correlation coefficient (R) of -0.057 and weighted average of 16.8%, a difference of 0.43%.
Cognitive Disability Correlation Summary
| Measurement | Dutch | Arapaho |
| Minimum | 4.2% | 8.6% |
| Maximum | 32.0% | 28.2% |
| Range | 27.8% | 19.5% |
| Mean | 15.8% | 16.2% |
| Median | 15.5% | 15.6% |
| Interquartile 25% (IQ1) | 13.4% | 13.2% |
| Interquartile 75% (IQ3) | 17.2% | 18.3% |
| Interquartile Range (IQR) | 3.9% | 5.0% |
| Standard Deviation (Sample) | 4.4% | 4.1% |
| Standard Deviation (Population) | 4.4% | 4.1% |
Demographics Similar to Dutch and Arapaho by Cognitive Disability
In terms of cognitive disability, the demographic groups most similar to Dutch are Finnish (16.8%, a difference of 0.010%), Immigrants from Lebanon (16.8%, a difference of 0.020%), English (16.8%, a difference of 0.040%), Asian (16.7%, a difference of 0.10%), and Jordanian (16.8%, a difference of 0.11%). Similarly, the demographic groups most similar to Arapaho are Albanian (16.8%, a difference of 0.010%), Uruguayan (16.8%, a difference of 0.010%), Indian (Asian) (16.8%, a difference of 0.040%), Immigrants from Sri Lanka (16.8%, a difference of 0.040%), and Canadian (16.8%, a difference of 0.060%).
| Demographics | Rating | Rank | Cognitive Disability |
| Immigrants | Southern Europe | 98.7 /100 | #93 | Exceptional 16.7% |
| Asians | 98.7 /100 | #94 | Exceptional 16.7% |
| English | 98.6 /100 | #95 | Exceptional 16.8% |
| Finns | 98.5 /100 | #96 | Exceptional 16.8% |
| Dutch | 98.5 /100 | #97 | Exceptional 16.8% |
| Immigrants | Lebanon | 98.4 /100 | #98 | Exceptional 16.8% |
| Jordanians | 98.2 /100 | #99 | Exceptional 16.8% |
| Immigrants | Russia | 98.2 /100 | #100 | Exceptional 16.8% |
| Immigrants | Asia | 98.1 /100 | #101 | Exceptional 16.8% |
| Irish | 98.1 /100 | #102 | Exceptional 16.8% |
| Paraguayans | 98.0 /100 | #103 | Exceptional 16.8% |
| Palestinians | 98.0 /100 | #104 | Exceptional 16.8% |
| Immigrants | Eastern Asia | 97.9 /100 | #105 | Exceptional 16.8% |
| Northern Europeans | 97.8 /100 | #106 | Exceptional 16.8% |
| Immigrants | Nicaragua | 97.8 /100 | #107 | Exceptional 16.8% |
| Canadians | 97.5 /100 | #108 | Exceptional 16.8% |
| Albanians | 97.3 /100 | #109 | Exceptional 16.8% |
| Arapaho | 97.3 /100 | #110 | Exceptional 16.8% |
| Uruguayans | 97.2 /100 | #111 | Exceptional 16.8% |
| Indians (Asian) | 97.2 /100 | #112 | Exceptional 16.8% |
| Immigrants | Sri Lanka | 97.1 /100 | #113 | Exceptional 16.8% |