Honduran vs Danish In Labor Force | Age 45-54
COMPARE
Honduran
Danish
In Labor Force | Age 45-54
In Labor Force | Age 45-54 Comparison
Hondurans
Danes
81.4%
IN LABOR FORCE | AGE 45-54
0.1/ 100
METRIC RATING
265th/ 347
METRIC RANK
83.3%
IN LABOR FORCE | AGE 45-54
95.3/ 100
METRIC RATING
92nd/ 347
METRIC RANK
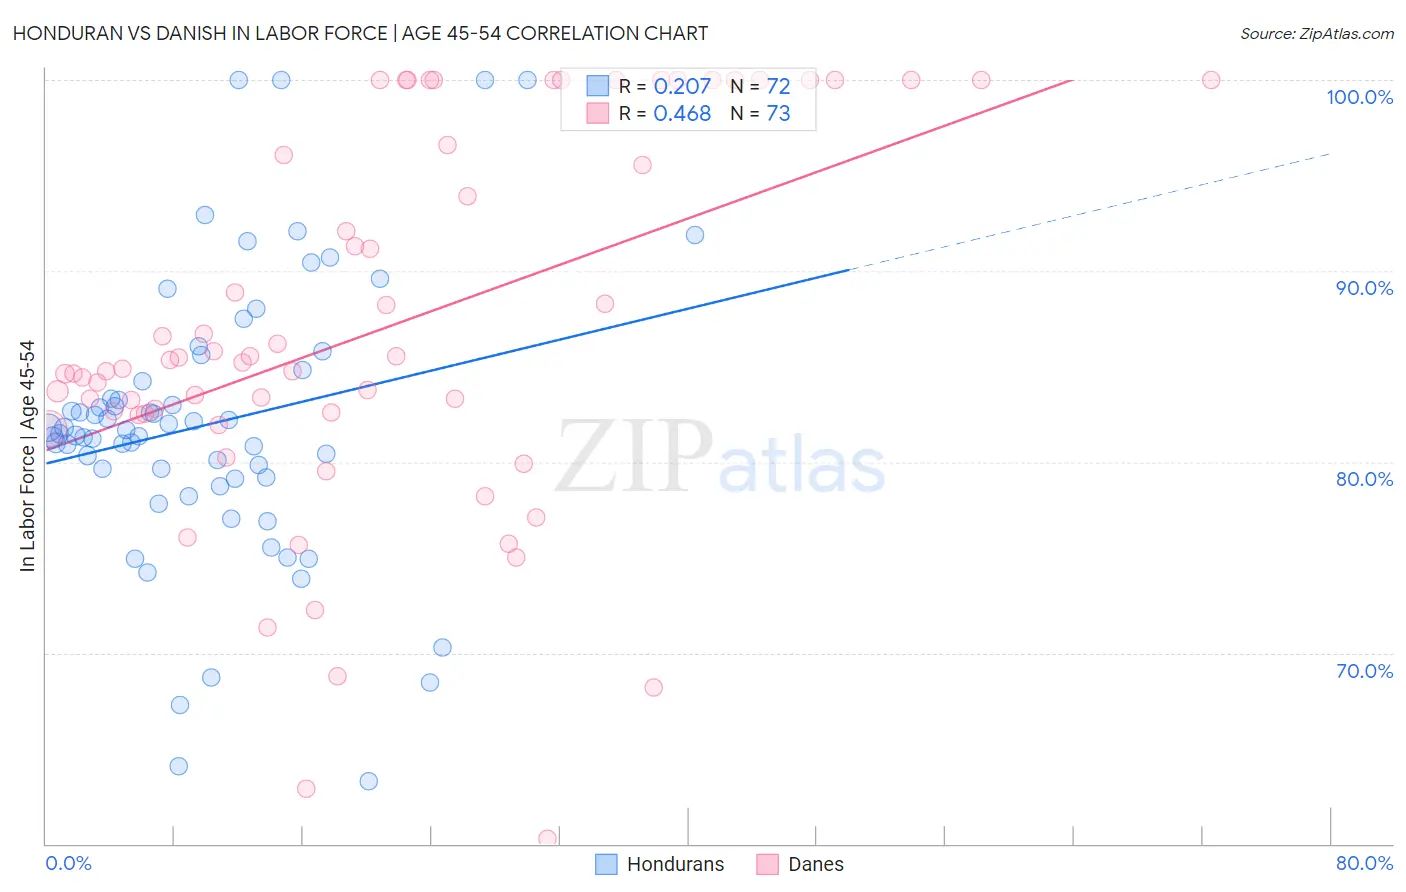
Honduran vs Danish In Labor Force | Age 45-54 Correlation Chart
The statistical analysis conducted on geographies consisting of 357,603,767 people shows a weak positive correlation between the proportion of Hondurans and labor force participation rate among population between the ages 45 and 54 in the United States with a correlation coefficient (R) of 0.207 and weighted average of 81.4%. Similarly, the statistical analysis conducted on geographies consisting of 473,839,684 people shows a moderate positive correlation between the proportion of Danes and labor force participation rate among population between the ages 45 and 54 in the United States with a correlation coefficient (R) of 0.468 and weighted average of 83.3%, a difference of 2.3%.
In Labor Force | Age 45-54 Correlation Summary
| Measurement | Honduran | Danish |
| Minimum | 63.3% | 60.2% |
| Maximum | 100.0% | 100.0% |
| Range | 36.7% | 39.8% |
| Mean | 82.0% | 87.0% |
| Median | 81.6% | 85.2% |
| Interquartile 25% (IQ1) | 79.1% | 82.5% |
| Interquartile 75% (IQ3) | 84.5% | 98.3% |
| Interquartile Range (IQR) | 5.4% | 15.8% |
| Standard Deviation (Sample) | 7.4% | 9.9% |
| Standard Deviation (Population) | 7.4% | 9.8% |
Similar Demographics by In Labor Force | Age 45-54
Demographics Similar to Hondurans by In Labor Force | Age 45-54
In terms of in labor force | age 45-54, the demographic groups most similar to Hondurans are Indonesian (81.5%, a difference of 0.050%), Immigrants from West Indies (81.5%, a difference of 0.050%), Immigrants from Guyana (81.5%, a difference of 0.060%), Hawaiian (81.5%, a difference of 0.070%), and Spaniard (81.5%, a difference of 0.080%).
| Demographics | Rating | Rank | In Labor Force | Age 45-54 |
| Immigrants | Fiji | 0.1 /100 | #258 | Tragic 81.5% |
| Guyanese | 0.1 /100 | #259 | Tragic 81.5% |
| Spaniards | 0.1 /100 | #260 | Tragic 81.5% |
| Hawaiians | 0.1 /100 | #261 | Tragic 81.5% |
| Immigrants | Guyana | 0.1 /100 | #262 | Tragic 81.5% |
| Indonesians | 0.1 /100 | #263 | Tragic 81.5% |
| Immigrants | West Indies | 0.1 /100 | #264 | Tragic 81.5% |
| Hondurans | 0.1 /100 | #265 | Tragic 81.4% |
| Immigrants | St. Vincent and the Grenadines | 0.1 /100 | #266 | Tragic 81.4% |
| West Indians | 0.1 /100 | #267 | Tragic 81.4% |
| Immigrants | Honduras | 0.0 /100 | #268 | Tragic 81.4% |
| Alsatians | 0.0 /100 | #269 | Tragic 81.3% |
| Bangladeshis | 0.0 /100 | #270 | Tragic 81.3% |
| Immigrants | Barbados | 0.0 /100 | #271 | Tragic 81.3% |
| Spanish | 0.0 /100 | #272 | Tragic 81.3% |
Demographics Similar to Danes by In Labor Force | Age 45-54
In terms of in labor force | age 45-54, the demographic groups most similar to Danes are Indian (Asian) (83.3%, a difference of 0.010%), Immigrants from Japan (83.3%, a difference of 0.010%), South American (83.3%, a difference of 0.010%), Italian (83.3%, a difference of 0.010%), and Immigrants from Northern Africa (83.3%, a difference of 0.020%).
| Demographics | Rating | Rank | In Labor Force | Age 45-54 |
| Greeks | 95.9 /100 | #85 | Exceptional 83.3% |
| Immigrants | Northern Africa | 95.7 /100 | #86 | Exceptional 83.3% |
| Immigrants | Eastern Europe | 95.6 /100 | #87 | Exceptional 83.3% |
| Immigrants | Asia | 95.6 /100 | #88 | Exceptional 83.3% |
| Indians (Asian) | 95.5 /100 | #89 | Exceptional 83.3% |
| Immigrants | Japan | 95.5 /100 | #90 | Exceptional 83.3% |
| South Americans | 95.5 /100 | #91 | Exceptional 83.3% |
| Danes | 95.3 /100 | #92 | Exceptional 83.3% |
| Italians | 95.1 /100 | #93 | Exceptional 83.3% |
| Argentineans | 94.9 /100 | #94 | Exceptional 83.3% |
| Immigrants | Argentina | 94.9 /100 | #95 | Exceptional 83.3% |
| Immigrants | Kuwait | 94.8 /100 | #96 | Exceptional 83.3% |
| Palestinians | 94.8 /100 | #97 | Exceptional 83.3% |
| Maltese | 94.4 /100 | #98 | Exceptional 83.3% |
| Immigrants | Middle Africa | 94.3 /100 | #99 | Exceptional 83.3% |