Guyanese vs Yakama In Labor Force | Age 20-24

COMPARE

Guyanese
Race
Ancestry
AfghanAfricanAlaska NativeAlaskan AthabascanAlbanianAleutAlsatianAmericanApacheArabArapahoArgentineanArmenianAssyrian/Chaldean/SyriacAustralianAustrianBahamianBangladeshiBarbadianBasqueBelgianBelizeanBermudanBhutaneseBlackfeetBolivianBrazilianBritishBritish West IndianBulgarianBurmeseCajunCambodianCanadianCape VerdeanCarpatho RusynCelticCentral AmericanCentral American IndianCherokeeCheyenneChickasawChileanChineseChippewaChoctawColombianColvilleComancheCosta RicanCreeCreekCroatianCrowCubanCypriotCzechCzechoslovakianDanishDelawareDominicanDutchDutch West IndianEastern EuropeanEcuadorianEgyptianEnglishEstonianEthiopianEuropeanFijianFilipinoFinnishFrenchFrench American IndianFrench CanadianGermanGerman RussianGhanaianGreekGuamanian/ChamorroGuatemalanGuyaneseHaitianHmongHonduranHopiHoumaHungarianIcelanderIndian (Asian)IndonesianInupiatIranianIraqiIrishIroquoisIsraeliItalianJamaicanJapaneseJordanianKenyanKiowaKoreanLaotianLatvianLebaneseLiberianLithuanianLumbeeLuxembourgerMacedonianMalaysianMalteseMarshalleseMenomineeMexicanMexican American IndianMongolianMoroccanNative HawaiianNavajoNepaleseNew ZealanderNicaraguanNigerianNorthern EuropeanNorwegianOkinawanOsageOttawaPaiutePakistaniPalestinianPanamanianParaguayanPennsylvania GermanPeruvianPimaPolishPortuguesePotawatomiPuebloPuerto RicanPuget Sound SalishRomanianRussianSalvadoranSamoanScandinavianScotch-IrishScottishSeminoleSenegaleseSerbianShoshoneSierra LeoneanSiouxSlavicSlovakSloveneSomaliSouth AfricanSouth AmericanSouth American IndianSoviet UnionSpaniardSpanishSpanish AmericanSpanish American IndianSri LankanSubsaharan AfricanSudaneseSwedishSwissSyrianTaiwaneseThaiTlingit-HaidaTohono O'OdhamTonganTrinidadian and TobagonianTsimshianTurkishU.S. Virgin IslanderUgandanUkrainianUruguayanUteVenezuelanVietnameseWelshWest IndianYaquiYugoslavianYumanYup'ikZimbabwean
Immigration
NonimmigrantsImmigrantsAfghanistanAfricaAlbaniaArgentinaArmeniaAsiaAustraliaAustriaBahamasBangladeshBarbadosBelarusBelgiumBelizeBoliviaBosnia and HerzegovinaBrazilBulgariaBurma/MyanmarCabo VerdeCambodiaCameroonCanadaCaribbeanCentral AmericaChileChinaColombiaCongoCosta RicaCroatiaCubaCzechoslovakiaDenmarkDominicaDominican RepublicEastern AfricaEastern AsiaEastern EuropeEcuadorEgyptEl SalvadorEnglandEritreaEthiopiaEuropeFijiFranceGermanyGhanaGreeceGrenadaGuatemalaGuyanaHaitiHondurasHong KongHungaryIndiaIndonesiaIranIraqIrelandIsraelItalyJamaicaJapanJordanKazakhstanKenyaKoreaKuwaitLaosLatin AmericaLatviaLebanonLiberiaLithuaniaMalaysiaMexicoMicronesiaMiddle AfricaMoldovaMoroccoNepalNetherlandsNicaraguaNigeriaNorth AmericaNorth MacedoniaNorthern AfricaNorthern EuropeNorwayOceaniaPakistanPanamaPeruPhilippinesPolandPortugalRomaniaRussiaSaudi ArabiaScotlandSenegalSerbiaSierra LeoneSingaporeSomaliaSouth AfricaSouth AmericaSouth Central AsiaSouth Eastern AsiaSouthern EuropeSpainSri LankaSt. Vincent and the GrenadinesSudanSwedenSwitzerlandSyriaTaiwanThailandTrinidad and TobagoTurkeyUgandaUkraineUruguayUzbekistanVenezuelaVietnamWest IndiesWestern AfricaWestern AsiaWestern EuropeYemenZaireZimbabweAzores
Yakama
Race
Ancestry
AfghanAfricanAlaska NativeAlaskan AthabascanAlbanianAleutAlsatianAmericanApacheArabArapahoArgentineanArmenianAssyrian/Chaldean/SyriacAustralianAustrianBahamianBangladeshiBarbadianBasqueBelgianBelizeanBermudanBhutaneseBlackfeetBolivianBrazilianBritishBritish West IndianBulgarianBurmeseCajunCambodianCanadianCape VerdeanCarpatho RusynCelticCentral AmericanCentral American IndianCherokeeCheyenneChickasawChileanChineseChippewaChoctawColombianColvilleComancheCosta RicanCreeCreekCroatianCrowCubanCypriotCzechCzechoslovakianDanishDelawareDominicanDutchDutch West IndianEastern EuropeanEcuadorianEgyptianEnglishEstonianEthiopianEuropeanFijianFilipinoFinnishFrenchFrench American IndianFrench CanadianGermanGerman RussianGhanaianGreekGuamanian/ChamorroGuatemalanHaitianHmongHonduranHopiHoumaHungarianIcelanderIndian (Asian)IndonesianInupiatIranianIraqiIrishIroquoisIsraeliItalianJamaicanJapaneseJordanianKenyanKiowaKoreanLaotianLatvianLebaneseLiberianLithuanianLumbeeLuxembourgerMacedonianMalaysianMalteseMarshalleseMenomineeMexicanMexican American IndianMongolianMoroccanNative HawaiianNavajoNepaleseNew ZealanderNicaraguanNigerianNorthern EuropeanNorwegianOkinawanOsageOttawaPaiutePakistaniPalestinianPanamanianParaguayanPennsylvania GermanPeruvianPimaPolishPortuguesePotawatomiPuebloPuerto RicanPuget Sound SalishRomanianRussianSalvadoranSamoanScandinavianScotch-IrishScottishSeminoleSenegaleseSerbianShoshoneSierra LeoneanSiouxSlavicSlovakSloveneSomaliSouth AfricanSouth AmericanSouth American IndianSoviet UnionSpaniardSpanishSpanish AmericanSpanish American IndianSri LankanSubsaharan AfricanSudaneseSwedishSwissSyrianTaiwaneseThaiTlingit-HaidaTohono O'OdhamTonganTrinidadian and TobagonianTsimshianTurkishU.S. Virgin IslanderUgandanUkrainianUruguayanUteVenezuelanVietnameseWelshWest IndianYakamaYaquiYugoslavianYumanYup'ikZimbabwean
Immigration
NonimmigrantsImmigrantsAfghanistanAfricaAlbaniaArgentinaArmeniaAsiaAustraliaAustriaBahamasBangladeshBarbadosBelarusBelgiumBelizeBoliviaBosnia and HerzegovinaBrazilBulgariaBurma/MyanmarCabo VerdeCambodiaCameroonCanadaCaribbeanCentral AmericaChileChinaColombiaCongoCosta RicaCroatiaCubaCzechoslovakiaDenmarkDominicaDominican RepublicEastern AfricaEastern AsiaEastern EuropeEcuadorEgyptEl SalvadorEnglandEritreaEthiopiaEuropeFijiFranceGermanyGhanaGreeceGrenadaGuatemalaGuyanaHaitiHondurasHong KongHungaryIndiaIndonesiaIranIraqIrelandIsraelItalyJamaicaJapanJordanKazakhstanKenyaKoreaKuwaitLaosLatin AmericaLatviaLebanonLiberiaLithuaniaMalaysiaMexicoMicronesiaMiddle AfricaMoldovaMoroccoNepalNetherlandsNicaraguaNigeriaNorth AmericaNorth MacedoniaNorthern AfricaNorthern EuropeNorwayOceaniaPakistanPanamaPeruPhilippinesPolandPortugalRomaniaRussiaSaudi ArabiaScotlandSenegalSerbiaSierra LeoneSingaporeSomaliaSouth AfricaSouth AmericaSouth Central AsiaSouth Eastern AsiaSouthern EuropeSpainSri LankaSt. Vincent and the GrenadinesSudanSwedenSwitzerlandSyriaTaiwanThailandTrinidad and TobagoTurkeyUgandaUkraineUruguayUzbekistanVenezuelaVietnamWest IndiesWestern AfricaWestern AsiaWestern EuropeYemenZaireZimbabweAzores
In Labor Force | Age 20-24
Income
Poverty
Unemployment
Labor Participation
Family Structure
Vehicle Availability
Education Level
Disability

In Labor Force | Age 20-24 Comparison

Guyanese

Yakama

Tragic
Average
69.2%
IN LABOR FORCE | AGE 20-24
0.0/ 100
METRIC RATING
337th/ 347
METRIC RANK
75.1%
IN LABOR FORCE | AGE 20-24
50.8/ 100
METRIC RATING
172nd/ 347
METRIC RANK

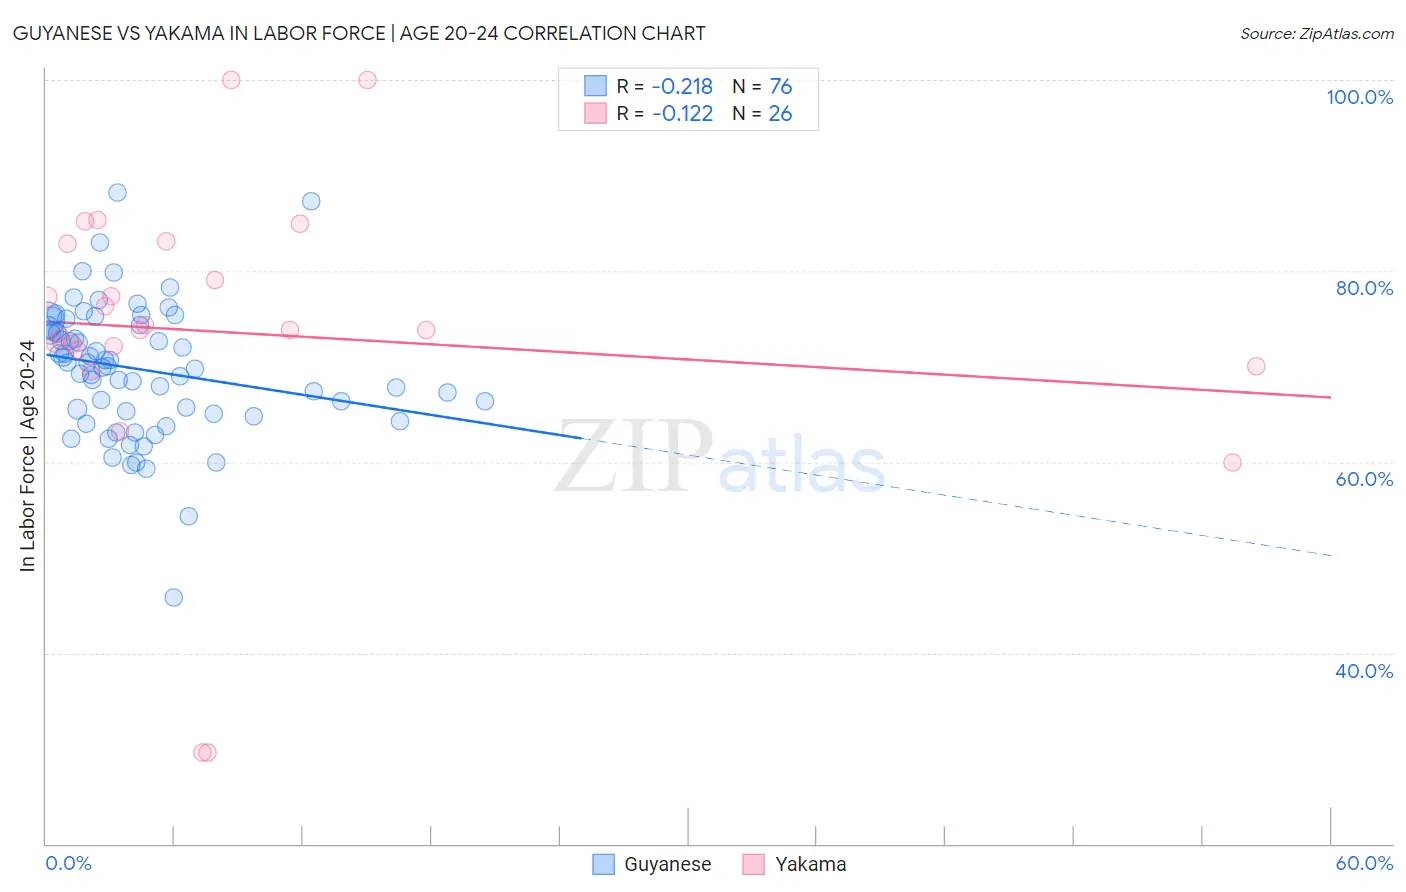
Guyanese vs Yakama In Labor Force | Age 20-24 Correlation Chart

The statistical analysis conducted on geographies consisting of 176,880,336 people shows a weak negative correlation between the proportion of Guyanese and labor force participation rate among population between the ages 20 and 24 in the United States with a correlation coefficient (R) of -0.218 and weighted average of 69.2%. Similarly, the statistical analysis conducted on geographies consisting of 19,914,894 people shows a poor negative correlation between the proportion of Yakama and labor force participation rate among population between the ages 20 and 24 in the United States with a correlation coefficient (R) of -0.122 and weighted average of 75.1%, a difference of 8.5%.
Guyanese vs Yakama In Labor Force | Age 20-24

In Labor Force | Age 20-24 Correlation Summary

MeasurementGuyaneseYakama
Minimum45.8%29.6%
Maximum88.3%100.0%
Range42.5%70.4%
Mean69.7%73.5%
Median70.2%73.8%
Interquartile 25% (IQ1)65.2%71.8%
Interquartile 75% (IQ3)74.2%82.9%
Interquartile Range (IQR)9.1%11.1%
Standard Deviation (Sample)6.9%15.8%
Standard Deviation (Population)6.9%15.5%

Similar Demographics by In Labor Force | Age 20-24

Demographics Similar to Guyanese by In Labor Force | Age 20-24

In terms of in labor force | age 20-24, the demographic groups most similar to Guyanese are Immigrants from Guyana (69.3%, a difference of 0.13%), Pima (69.0%, a difference of 0.26%), Immigrants from Yemen (68.9%, a difference of 0.39%), Menominee (68.7%, a difference of 0.70%), and Immigrants from Barbados (69.7%, a difference of 0.79%).
DemographicsRating | RankIn Labor Force | Age 20-24
Vietnamese
0.0
/100
|
#330
Tragic
70.6%
Immigrants | Bangladesh
0.0
/100
|
#331
Tragic
70.6%
Immigrants | Uzbekistan
0.0
/100
|
#332
Tragic
70.4%
Yuman
0.0
/100
|
#333
Tragic
70.3%
British West Indians
0.0
/100
|
#334
Tragic
70.0%
Immigrants | Barbados
0.0
/100
|
#335
Tragic
69.7%
Immigrants | Guyana
0.0
/100
|
#336
Tragic
69.3%
Guyanese
0.0
/100
|
#337
Tragic
69.2%
Pima
0.0
/100
|
#338
Tragic
69.0%
Immigrants | Yemen
0.0
/100
|
#339
Tragic
68.9%
Menominee
0.0
/100
|
#340
Tragic
68.7%
Tohono O'odham
0.0
/100
|
#341
Tragic
68.6%
Immigrants | St. Vincent and the Grenadines
0.0
/100
|
#342
Tragic
68.4%
Puerto Ricans
0.0
/100
|
#343
Tragic
68.3%
Immigrants | Grenada
0.0
/100
|
#344
Tragic
67.2%

Demographics Similar to Yakama by In Labor Force | Age 20-24

In terms of in labor force | age 20-24, the demographic groups most similar to Yakama are Cajun (75.1%, a difference of 0.010%), Immigrants from Croatia (75.1%, a difference of 0.010%), South African (75.0%, a difference of 0.010%), Mexican (75.1%, a difference of 0.020%), and Syrian (75.0%, a difference of 0.020%).
DemographicsRating | RankIn Labor Force | Age 20-24
Afghans
63.5
/100
|
#165
Good
75.2%
Cambodians
60.5
/100
|
#166
Good
75.2%
Immigrants | South Eastern Asia
57.5
/100
|
#167
Average
75.1%
Immigrants | Western Africa
56.7
/100
|
#168
Average
75.1%
Immigrants | Philippines
55.8
/100
|
#169
Average
75.1%
Mexicans
52.1
/100
|
#170
Average
75.1%
Cajuns
51.1
/100
|
#171
Average
75.1%
Yakama
50.8
/100
|
#172
Average
75.1%
Immigrants | Croatia
50.2
/100
|
#173
Average
75.1%
South Africans
50.0
/100
|
#174
Average
75.0%
Syrians
49.5
/100
|
#175
Average
75.0%
Central Americans
48.7
/100
|
#176
Average
75.0%
Immigrants | Mexico
47.8
/100
|
#177
Average
75.0%
Immigrants | Central America
45.0
/100
|
#178
Average
75.0%
Immigrants | Latvia
44.1
/100
|
#179
Average
75.0%