Guyanese vs Immigrants from Austria Kindergarten
COMPARE
Guyanese
Immigrants from Austria
Kindergarten
Kindergarten Comparison
Guyanese
Immigrants from Austria
96.9%
KINDERGARTEN
0.0/ 100
METRIC RATING
312th/ 347
METRIC RANK
98.4%
KINDERGARTEN
99.6/ 100
METRIC RATING
69th/ 347
METRIC RANK
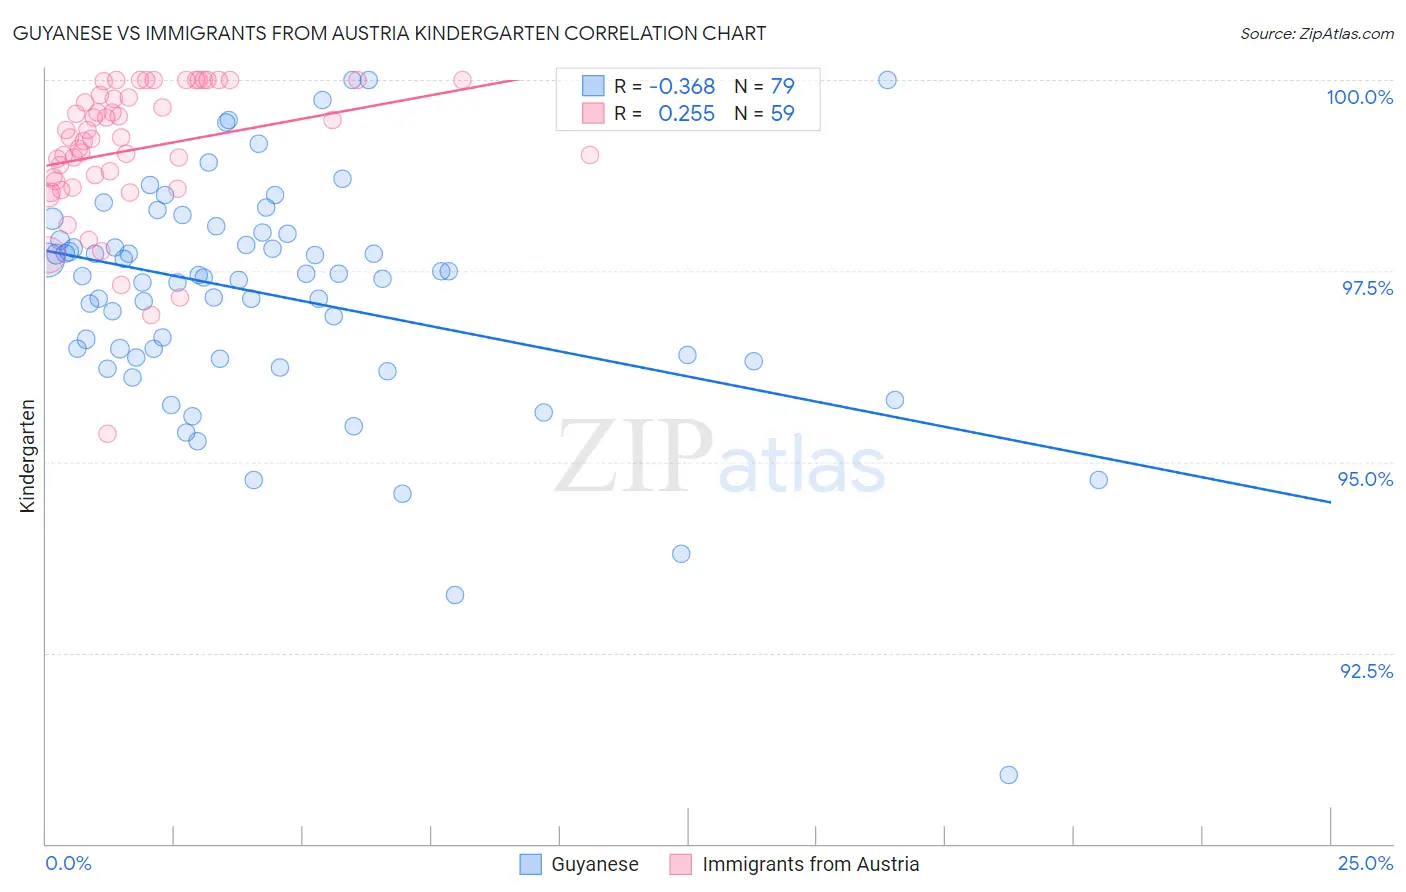
Guyanese vs Immigrants from Austria Kindergarten Correlation Chart
The statistical analysis conducted on geographies consisting of 176,921,765 people shows a mild negative correlation between the proportion of Guyanese and percentage of population with at least kindergarten education in the United States with a correlation coefficient (R) of -0.368 and weighted average of 96.9%. Similarly, the statistical analysis conducted on geographies consisting of 167,973,800 people shows a weak positive correlation between the proportion of Immigrants from Austria and percentage of population with at least kindergarten education in the United States with a correlation coefficient (R) of 0.255 and weighted average of 98.4%, a difference of 1.5%.
Kindergarten Correlation Summary
| Measurement | Guyanese | Immigrants from Austria |
| Minimum | 90.9% | 95.4% |
| Maximum | 100.0% | 100.0% |
| Range | 9.1% | 4.6% |
| Mean | 97.2% | 99.1% |
| Median | 97.4% | 99.2% |
| Interquartile 25% (IQ1) | 96.4% | 98.7% |
| Interquartile 75% (IQ3) | 98.0% | 99.8% |
| Interquartile Range (IQR) | 1.6% | 1.1% |
| Standard Deviation (Sample) | 1.5% | 0.92% |
| Standard Deviation (Population) | 1.5% | 0.91% |
Similar Demographics by Kindergarten
Demographics Similar to Guyanese by Kindergarten
In terms of kindergarten, the demographic groups most similar to Guyanese are Cape Verdean (96.9%, a difference of 0.010%), Honduran (96.9%, a difference of 0.010%), Immigrants from the Azores (97.0%, a difference of 0.020%), Sri Lankan (97.0%, a difference of 0.020%), and Immigrants from Somalia (97.0%, a difference of 0.030%).
| Demographics | Rating | Rank | Kindergarten |
| Ecuadorians | 0.0 /100 | #305 | Tragic 97.0% |
| Belizeans | 0.0 /100 | #306 | Tragic 97.0% |
| Hispanics or Latinos | 0.0 /100 | #307 | Tragic 97.0% |
| Immigrants | Somalia | 0.0 /100 | #308 | Tragic 97.0% |
| Immigrants | Haiti | 0.0 /100 | #309 | Tragic 97.0% |
| Immigrants | Azores | 0.0 /100 | #310 | Tragic 97.0% |
| Sri Lankans | 0.0 /100 | #311 | Tragic 97.0% |
| Guyanese | 0.0 /100 | #312 | Tragic 96.9% |
| Cape Verdeans | 0.0 /100 | #313 | Tragic 96.9% |
| Hondurans | 0.0 /100 | #314 | Tragic 96.9% |
| Immigrants | Belize | 0.0 /100 | #315 | Tragic 96.9% |
| Immigrants | Nicaragua | 0.0 /100 | #316 | Tragic 96.9% |
| Immigrants | Ecuador | 0.0 /100 | #317 | Tragic 96.9% |
| Immigrants | Laos | 0.0 /100 | #318 | Tragic 96.9% |
| Immigrants | Guyana | 0.0 /100 | #319 | Tragic 96.8% |
Demographics Similar to Immigrants from Austria by Kindergarten
In terms of kindergarten, the demographic groups most similar to Immigrants from Austria are Canadian (98.4%, a difference of 0.0%), Immigrants from Northern Europe (98.4%, a difference of 0.0%), Russian (98.4%, a difference of 0.0%), Chickasaw (98.4%, a difference of 0.0%), and Serbian (98.4%, a difference of 0.0%).
| Demographics | Rating | Rank | Kindergarten |
| New Zealanders | 99.7 /100 | #62 | Exceptional 98.4% |
| Immigrants | North America | 99.7 /100 | #63 | Exceptional 98.4% |
| Greeks | 99.7 /100 | #64 | Exceptional 98.4% |
| Maltese | 99.7 /100 | #65 | Exceptional 98.4% |
| Cheyenne | 99.6 /100 | #66 | Exceptional 98.4% |
| Canadians | 99.6 /100 | #67 | Exceptional 98.4% |
| Immigrants | Northern Europe | 99.6 /100 | #68 | Exceptional 98.4% |
| Immigrants | Austria | 99.6 /100 | #69 | Exceptional 98.4% |
| Russians | 99.6 /100 | #70 | Exceptional 98.4% |
| Chickasaw | 99.6 /100 | #71 | Exceptional 98.4% |
| Serbians | 99.6 /100 | #72 | Exceptional 98.4% |
| Cajuns | 99.4 /100 | #73 | Exceptional 98.3% |
| Immigrants | Netherlands | 99.3 /100 | #74 | Exceptional 98.3% |
| Cherokee | 99.3 /100 | #75 | Exceptional 98.3% |
| Immigrants | England | 99.3 /100 | #76 | Exceptional 98.3% |