Guatemalan vs Immigrants from Belarus 5th Grade
COMPARE
Guatemalan
Immigrants from Belarus
5th Grade
5th Grade Comparison
Guatemalans
Immigrants from Belarus
94.8%
5TH GRADE
0.0/ 100
METRIC RATING
340th/ 347
METRIC RANK
97.3%
5TH GRADE
54.6/ 100
METRIC RATING
167th/ 347
METRIC RANK
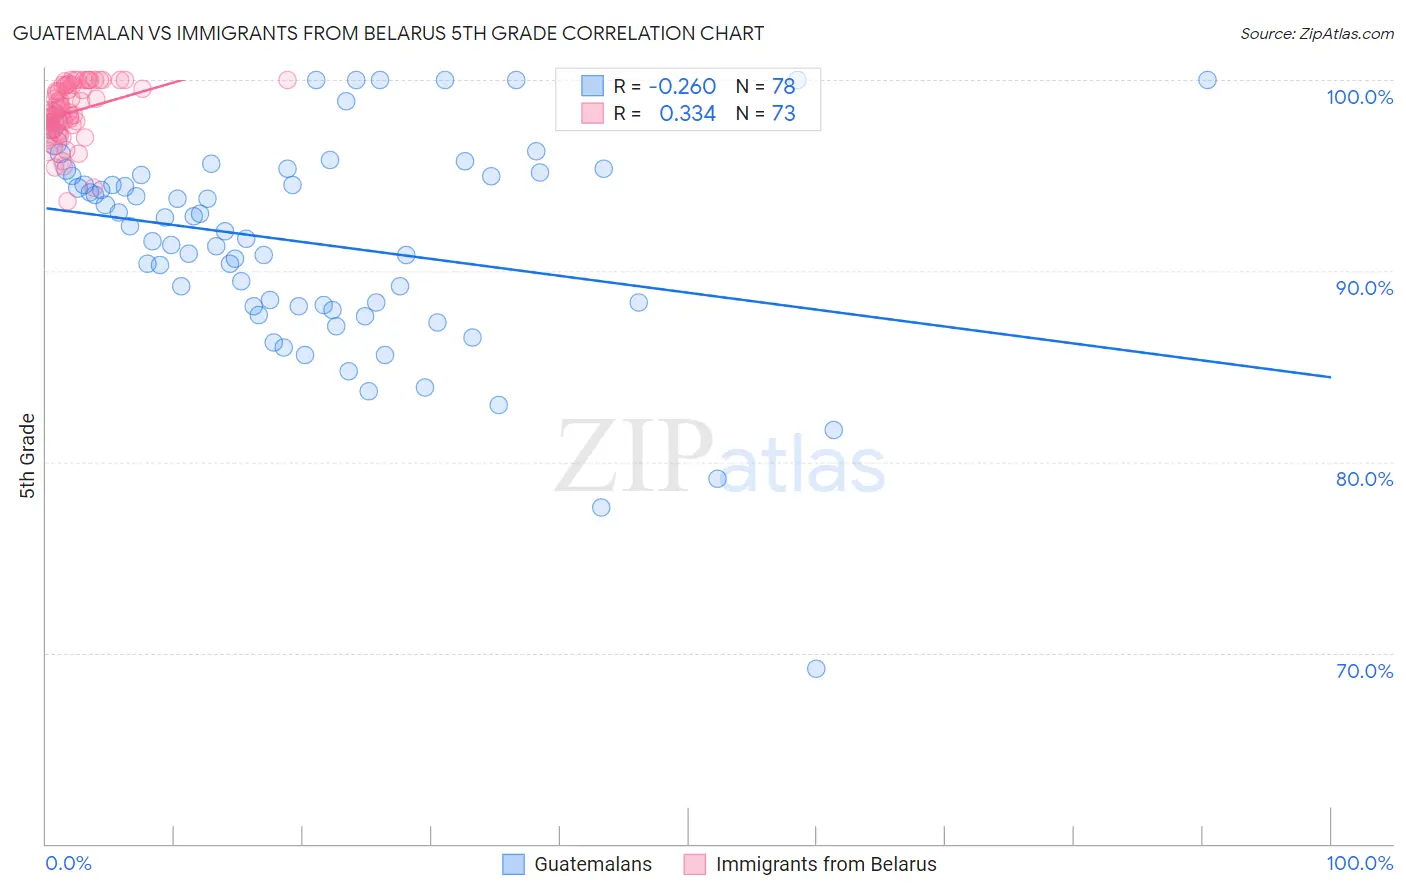
Guatemalan vs Immigrants from Belarus 5th Grade Correlation Chart
The statistical analysis conducted on geographies consisting of 409,566,469 people shows a weak negative correlation between the proportion of Guatemalans and percentage of population with at least 5th grade education in the United States with a correlation coefficient (R) of -0.260 and weighted average of 94.8%. Similarly, the statistical analysis conducted on geographies consisting of 150,073,430 people shows a mild positive correlation between the proportion of Immigrants from Belarus and percentage of population with at least 5th grade education in the United States with a correlation coefficient (R) of 0.334 and weighted average of 97.3%, a difference of 2.6%.
5th Grade Correlation Summary
| Measurement | Guatemalan | Immigrants from Belarus |
| Minimum | 69.2% | 93.6% |
| Maximum | 100.0% | 100.0% |
| Range | 30.8% | 6.4% |
| Mean | 91.5% | 98.3% |
| Median | 92.2% | 98.3% |
| Interquartile 25% (IQ1) | 88.2% | 97.4% |
| Interquartile 75% (IQ3) | 95.0% | 99.7% |
| Interquartile Range (IQR) | 6.8% | 2.3% |
| Standard Deviation (Sample) | 5.6% | 1.5% |
| Standard Deviation (Population) | 5.6% | 1.4% |
Similar Demographics by 5th Grade
Demographics Similar to Guatemalans by 5th Grade
In terms of 5th grade, the demographic groups most similar to Guatemalans are Immigrants from Yemen (94.9%, a difference of 0.030%), Immigrants from Cabo Verde (94.9%, a difference of 0.070%), Yakama (94.8%, a difference of 0.080%), Immigrants from Central America (94.7%, a difference of 0.18%), and Central American (95.1%, a difference of 0.23%).
| Demographics | Rating | Rank | 5th Grade |
| Immigrants | Latin America | 0.0 /100 | #333 | Tragic 95.3% |
| Nepalese | 0.0 /100 | #334 | Tragic 95.2% |
| Mexicans | 0.0 /100 | #335 | Tragic 95.2% |
| Immigrants | Azores | 0.0 /100 | #336 | Tragic 95.1% |
| Central Americans | 0.0 /100 | #337 | Tragic 95.1% |
| Immigrants | Cabo Verde | 0.0 /100 | #338 | Tragic 94.9% |
| Immigrants | Yemen | 0.0 /100 | #339 | Tragic 94.9% |
| Guatemalans | 0.0 /100 | #340 | Tragic 94.8% |
| Yakama | 0.0 /100 | #341 | Tragic 94.8% |
| Immigrants | Central America | 0.0 /100 | #342 | Tragic 94.7% |
| Salvadorans | 0.0 /100 | #343 | Tragic 94.6% |
| Immigrants | Mexico | 0.0 /100 | #344 | Tragic 94.6% |
| Immigrants | Guatemala | 0.0 /100 | #345 | Tragic 94.6% |
| Immigrants | El Salvador | 0.0 /100 | #346 | Tragic 94.3% |
| Spanish American Indians | 0.0 /100 | #347 | Tragic 94.2% |
Demographics Similar to Immigrants from Belarus by 5th Grade
In terms of 5th grade, the demographic groups most similar to Immigrants from Belarus are Chilean (97.3%, a difference of 0.0%), Immigrants from Korea (97.3%, a difference of 0.0%), Venezuelan (97.3%, a difference of 0.0%), Immigrants from Sri Lanka (97.3%, a difference of 0.0%), and Arab (97.3%, a difference of 0.0%).
| Demographics | Rating | Rank | 5th Grade |
| Marshallese | 61.2 /100 | #160 | Good 97.4% |
| Kenyans | 59.7 /100 | #161 | Average 97.4% |
| Immigrants | Iran | 59.5 /100 | #162 | Average 97.4% |
| Ugandans | 58.9 /100 | #163 | Average 97.4% |
| Bermudans | 58.8 /100 | #164 | Average 97.4% |
| Immigrants | Poland | 57.9 /100 | #165 | Average 97.4% |
| Apache | 57.2 /100 | #166 | Average 97.4% |
| Immigrants | Belarus | 54.6 /100 | #167 | Average 97.3% |
| Chileans | 54.5 /100 | #168 | Average 97.3% |
| Immigrants | Korea | 54.1 /100 | #169 | Average 97.3% |
| Venezuelans | 54.0 /100 | #170 | Average 97.3% |
| Immigrants | Sri Lanka | 53.8 /100 | #171 | Average 97.3% |
| Arabs | 53.4 /100 | #172 | Average 97.3% |
| Egyptians | 52.4 /100 | #173 | Average 97.3% |
| Immigrants | Kazakhstan | 50.0 /100 | #174 | Average 97.3% |