Immigrants from Eritrea vs Immigrants from Belarus Cognitive Disability
COMPARE
Immigrants from Eritrea
Immigrants from Belarus
Cognitive Disability
Cognitive Disability Comparison
Immigrants from Eritrea
Immigrants from Belarus
18.3%
COGNITIVE DISABILITY
0.0/ 100
METRIC RATING
304th/ 347
METRIC RANK
16.5%
COGNITIVE DISABILITY
99.9/ 100
METRIC RATING
40th/ 347
METRIC RANK
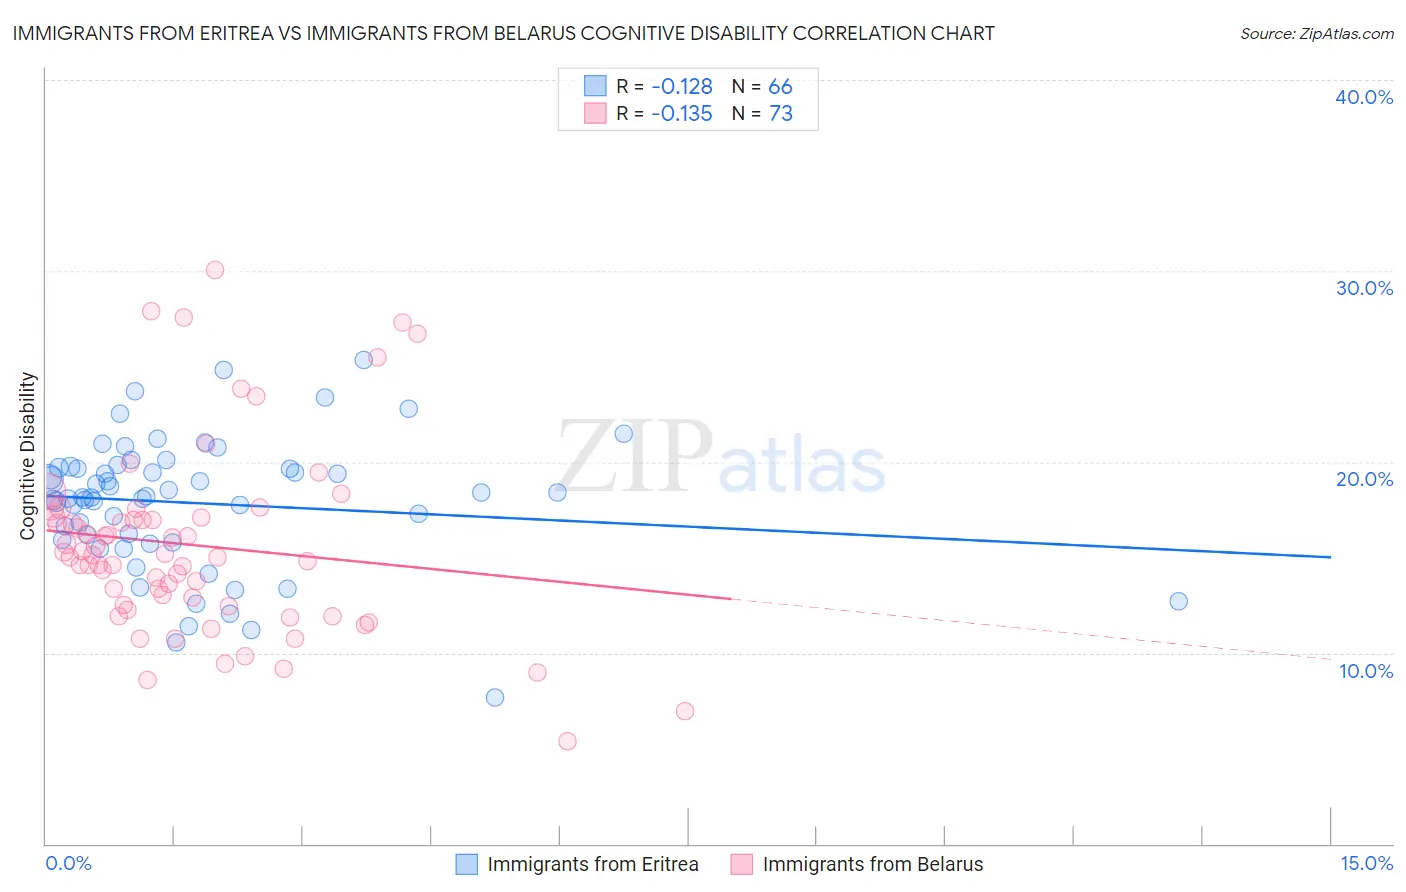
Immigrants from Eritrea vs Immigrants from Belarus Cognitive Disability Correlation Chart
The statistical analysis conducted on geographies consisting of 104,852,207 people shows a poor negative correlation between the proportion of Immigrants from Eritrea and percentage of population with cognitive disability in the United States with a correlation coefficient (R) of -0.128 and weighted average of 18.3%. Similarly, the statistical analysis conducted on geographies consisting of 150,194,359 people shows a poor negative correlation between the proportion of Immigrants from Belarus and percentage of population with cognitive disability in the United States with a correlation coefficient (R) of -0.135 and weighted average of 16.5%, a difference of 11.3%.
Cognitive Disability Correlation Summary
| Measurement | Immigrants from Eritrea | Immigrants from Belarus |
| Minimum | 7.7% | 5.4% |
| Maximum | 25.3% | 30.1% |
| Range | 17.7% | 24.7% |
| Mean | 17.8% | 15.6% |
| Median | 18.2% | 15.1% |
| Interquartile 25% (IQ1) | 15.9% | 12.5% |
| Interquartile 75% (IQ3) | 19.7% | 17.1% |
| Interquartile Range (IQR) | 3.8% | 4.6% |
| Standard Deviation (Sample) | 3.4% | 4.9% |
| Standard Deviation (Population) | 3.4% | 4.9% |
Similar Demographics by Cognitive Disability
Demographics Similar to Immigrants from Eritrea by Cognitive Disability
In terms of cognitive disability, the demographic groups most similar to Immigrants from Eritrea are Immigrants from Kenya (18.3%, a difference of 0.050%), Barbadian (18.3%, a difference of 0.060%), Colville (18.3%, a difference of 0.12%), Seminole (18.3%, a difference of 0.13%), and Ugandan (18.3%, a difference of 0.13%).
| Demographics | Rating | Rank | Cognitive Disability |
| Blackfeet | 0.0 /100 | #297 | Tragic 18.3% |
| Japanese | 0.0 /100 | #298 | Tragic 18.3% |
| Ghanaians | 0.0 /100 | #299 | Tragic 18.3% |
| Creek | 0.0 /100 | #300 | Tragic 18.3% |
| Immigrants | Ghana | 0.0 /100 | #301 | Tragic 18.3% |
| Barbadians | 0.0 /100 | #302 | Tragic 18.3% |
| Immigrants | Kenya | 0.0 /100 | #303 | Tragic 18.3% |
| Immigrants | Eritrea | 0.0 /100 | #304 | Tragic 18.3% |
| Colville | 0.0 /100 | #305 | Tragic 18.3% |
| Seminole | 0.0 /100 | #306 | Tragic 18.3% |
| Ugandans | 0.0 /100 | #307 | Tragic 18.3% |
| Immigrants | Western Africa | 0.0 /100 | #308 | Tragic 18.4% |
| Immigrants | Eastern Africa | 0.0 /100 | #309 | Tragic 18.4% |
| Choctaw | 0.0 /100 | #310 | Tragic 18.4% |
| Hmong | 0.0 /100 | #311 | Tragic 18.4% |
Demographics Similar to Immigrants from Belarus by Cognitive Disability
In terms of cognitive disability, the demographic groups most similar to Immigrants from Belarus are Cuban (16.5%, a difference of 0.0%), Bolivian (16.5%, a difference of 0.010%), Hungarian (16.5%, a difference of 0.020%), Immigrants from Canada (16.5%, a difference of 0.080%), and Immigrants from Eastern Europe (16.5%, a difference of 0.090%).
| Demographics | Rating | Rank | Cognitive Disability |
| Italians | 99.9 /100 | #33 | Exceptional 16.4% |
| Russians | 99.9 /100 | #34 | Exceptional 16.4% |
| Slovaks | 99.9 /100 | #35 | Exceptional 16.4% |
| Greeks | 99.9 /100 | #36 | Exceptional 16.4% |
| Slovenes | 99.9 /100 | #37 | Exceptional 16.5% |
| Immigrants | Eastern Europe | 99.9 /100 | #38 | Exceptional 16.5% |
| Bolivians | 99.9 /100 | #39 | Exceptional 16.5% |
| Immigrants | Belarus | 99.9 /100 | #40 | Exceptional 16.5% |
| Cubans | 99.9 /100 | #41 | Exceptional 16.5% |
| Hungarians | 99.9 /100 | #42 | Exceptional 16.5% |
| Immigrants | Canada | 99.8 /100 | #43 | Exceptional 16.5% |
| Macedonians | 99.8 /100 | #44 | Exceptional 16.5% |
| Immigrants | Europe | 99.8 /100 | #45 | Exceptional 16.5% |
| Immigrants | Colombia | 99.8 /100 | #46 | Exceptional 16.5% |
| Immigrants | Italy | 99.8 /100 | #47 | Exceptional 16.5% |