Egyptian vs Immigrants from Belarus Cognitive Disability
COMPARE
Egyptian
Immigrants from Belarus
Cognitive Disability
Cognitive Disability Comparison
Egyptians
Immigrants from Belarus
16.7%
COGNITIVE DISABILITY
99.2/ 100
METRIC RATING
80th/ 347
METRIC RANK
16.5%
COGNITIVE DISABILITY
99.9/ 100
METRIC RATING
40th/ 347
METRIC RANK
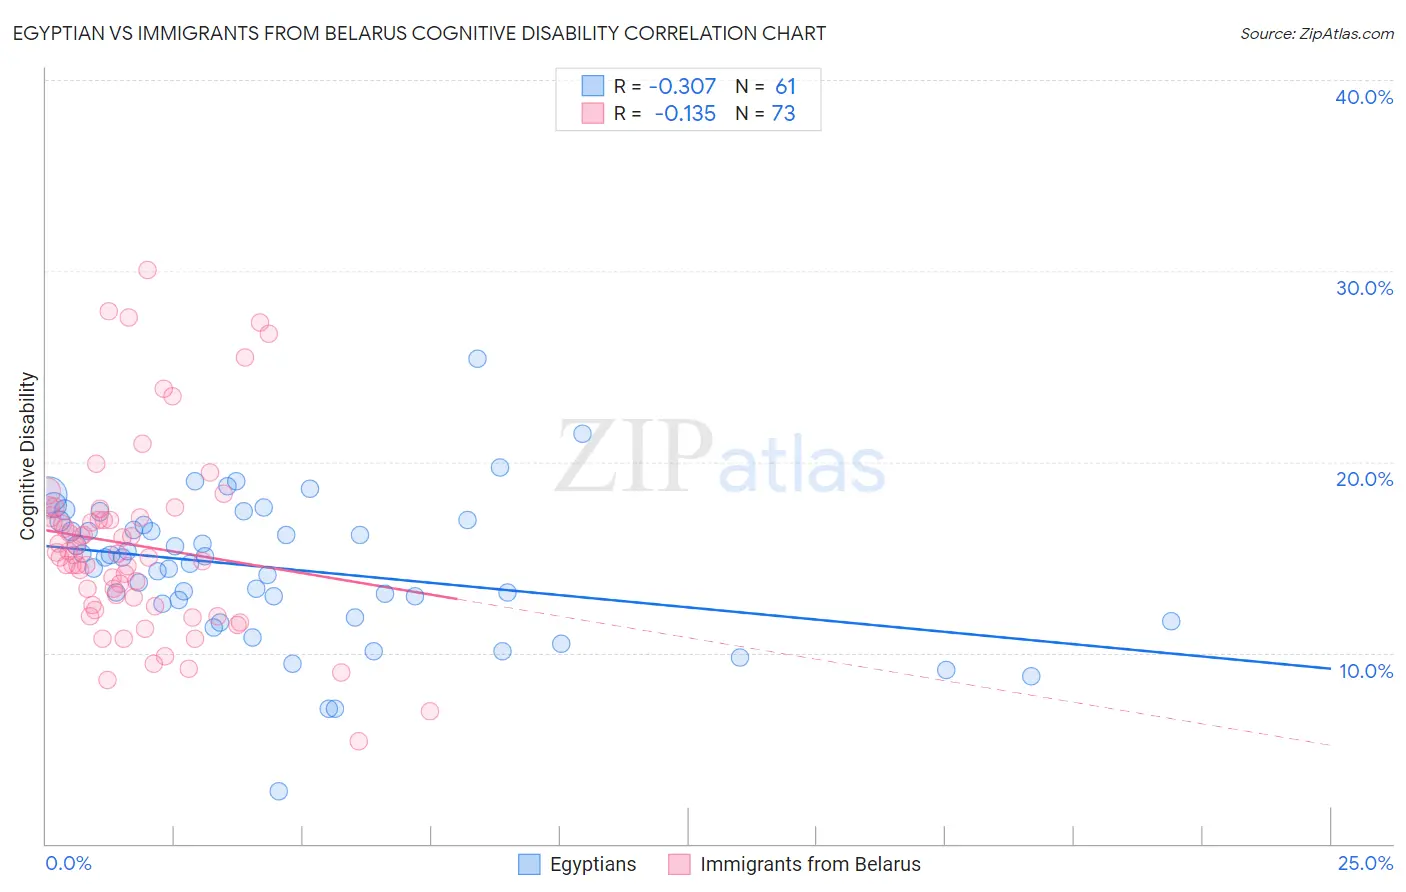
Egyptian vs Immigrants from Belarus Cognitive Disability Correlation Chart
The statistical analysis conducted on geographies consisting of 276,907,223 people shows a mild negative correlation between the proportion of Egyptians and percentage of population with cognitive disability in the United States with a correlation coefficient (R) of -0.307 and weighted average of 16.7%. Similarly, the statistical analysis conducted on geographies consisting of 150,194,359 people shows a poor negative correlation between the proportion of Immigrants from Belarus and percentage of population with cognitive disability in the United States with a correlation coefficient (R) of -0.135 and weighted average of 16.5%, a difference of 1.3%.
Cognitive Disability Correlation Summary
| Measurement | Egyptian | Immigrants from Belarus |
| Minimum | 2.7% | 5.4% |
| Maximum | 25.4% | 30.1% |
| Range | 22.7% | 24.7% |
| Mean | 14.4% | 15.6% |
| Median | 15.0% | 15.1% |
| Interquartile 25% (IQ1) | 12.2% | 12.5% |
| Interquartile 75% (IQ3) | 16.8% | 17.1% |
| Interquartile Range (IQR) | 4.6% | 4.6% |
| Standard Deviation (Sample) | 3.8% | 4.9% |
| Standard Deviation (Population) | 3.7% | 4.9% |
Similar Demographics by Cognitive Disability
Demographics Similar to Egyptians by Cognitive Disability
In terms of cognitive disability, the demographic groups most similar to Egyptians are Immigrants from Netherlands (16.7%, a difference of 0.010%), Peruvian (16.7%, a difference of 0.030%), Immigrants from Bulgaria (16.7%, a difference of 0.030%), Immigrants from Serbia (16.7%, a difference of 0.040%), and Immigrants from Hungary (16.7%, a difference of 0.040%).
| Demographics | Rating | Rank | Cognitive Disability |
| Burmese | 99.3 /100 | #73 | Exceptional 16.7% |
| Slavs | 99.3 /100 | #74 | Exceptional 16.7% |
| Estonians | 99.3 /100 | #75 | Exceptional 16.7% |
| Immigrants | Serbia | 99.3 /100 | #76 | Exceptional 16.7% |
| Immigrants | Hungary | 99.3 /100 | #77 | Exceptional 16.7% |
| Peruvians | 99.3 /100 | #78 | Exceptional 16.7% |
| Immigrants | Bulgaria | 99.3 /100 | #79 | Exceptional 16.7% |
| Egyptians | 99.2 /100 | #80 | Exceptional 16.7% |
| Immigrants | Netherlands | 99.2 /100 | #81 | Exceptional 16.7% |
| Swiss | 99.2 /100 | #82 | Exceptional 16.7% |
| Serbians | 99.1 /100 | #83 | Exceptional 16.7% |
| Belgians | 99.1 /100 | #84 | Exceptional 16.7% |
| Immigrants | Moldova | 99.1 /100 | #85 | Exceptional 16.7% |
| Immigrants | South Africa | 99.0 /100 | #86 | Exceptional 16.7% |
| Native Hawaiians | 99.0 /100 | #87 | Exceptional 16.7% |
Demographics Similar to Immigrants from Belarus by Cognitive Disability
In terms of cognitive disability, the demographic groups most similar to Immigrants from Belarus are Cuban (16.5%, a difference of 0.0%), Bolivian (16.5%, a difference of 0.010%), Hungarian (16.5%, a difference of 0.020%), Immigrants from Canada (16.5%, a difference of 0.080%), and Immigrants from Eastern Europe (16.5%, a difference of 0.090%).
| Demographics | Rating | Rank | Cognitive Disability |
| Italians | 99.9 /100 | #33 | Exceptional 16.4% |
| Russians | 99.9 /100 | #34 | Exceptional 16.4% |
| Slovaks | 99.9 /100 | #35 | Exceptional 16.4% |
| Greeks | 99.9 /100 | #36 | Exceptional 16.4% |
| Slovenes | 99.9 /100 | #37 | Exceptional 16.5% |
| Immigrants | Eastern Europe | 99.9 /100 | #38 | Exceptional 16.5% |
| Bolivians | 99.9 /100 | #39 | Exceptional 16.5% |
| Immigrants | Belarus | 99.9 /100 | #40 | Exceptional 16.5% |
| Cubans | 99.9 /100 | #41 | Exceptional 16.5% |
| Hungarians | 99.9 /100 | #42 | Exceptional 16.5% |
| Immigrants | Canada | 99.8 /100 | #43 | Exceptional 16.5% |
| Macedonians | 99.8 /100 | #44 | Exceptional 16.5% |
| Immigrants | Europe | 99.8 /100 | #45 | Exceptional 16.5% |
| Immigrants | Colombia | 99.8 /100 | #46 | Exceptional 16.5% |
| Immigrants | Italy | 99.8 /100 | #47 | Exceptional 16.5% |