Okinawan vs Shoshone Disability Age 35 to 64
COMPARE
Okinawan
Shoshone
Disability Age 35 to 64
Disability Age 35 to 64 Comparison
Okinawans
Shoshone
9.4%
DISABILITY AGE 35 TO 64
100.0/ 100
METRIC RATING
21st/ 347
METRIC RANK
14.5%
DISABILITY AGE 35 TO 64
0.0/ 100
METRIC RATING
314th/ 347
METRIC RANK
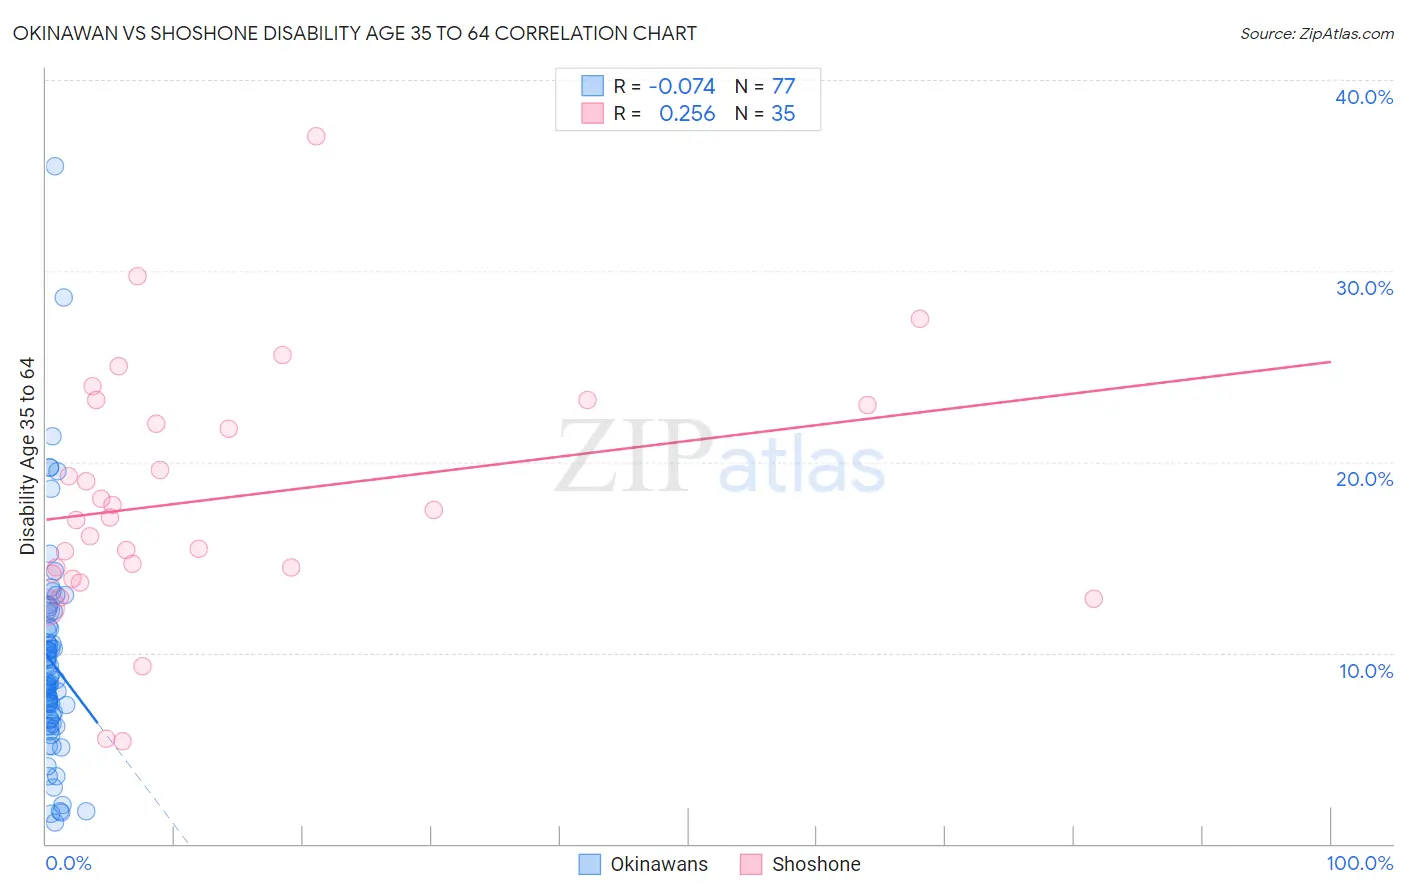
Okinawan vs Shoshone Disability Age 35 to 64 Correlation Chart
The statistical analysis conducted on geographies consisting of 73,717,976 people shows a slight negative correlation between the proportion of Okinawans and percentage of population with a disability between the ages 34 and 64 in the United States with a correlation coefficient (R) of -0.074 and weighted average of 9.4%. Similarly, the statistical analysis conducted on geographies consisting of 66,618,836 people shows a weak positive correlation between the proportion of Shoshone and percentage of population with a disability between the ages 34 and 64 in the United States with a correlation coefficient (R) of 0.256 and weighted average of 14.5%, a difference of 54.5%.
Disability Age 35 to 64 Correlation Summary
| Measurement | Okinawan | Shoshone |
| Minimum | 1.1% | 5.4% |
| Maximum | 35.5% | 37.1% |
| Range | 34.4% | 31.7% |
| Mean | 9.5% | 18.1% |
| Median | 8.4% | 17.1% |
| Interquartile 25% (IQ1) | 6.4% | 14.1% |
| Interquartile 75% (IQ3) | 11.3% | 23.0% |
| Interquartile Range (IQR) | 4.9% | 8.9% |
| Standard Deviation (Sample) | 5.7% | 6.5% |
| Standard Deviation (Population) | 5.7% | 6.4% |
Similar Demographics by Disability Age 35 to 64
Demographics Similar to Okinawans by Disability Age 35 to 64
In terms of disability age 35 to 64, the demographic groups most similar to Okinawans are Cypriot (9.4%, a difference of 0.030%), Argentinean (9.4%, a difference of 0.25%), Asian (9.4%, a difference of 0.26%), Immigrants from Argentina (9.3%, a difference of 0.43%), and Venezuelan (9.4%, a difference of 0.56%).
| Demographics | Rating | Rank | Disability Age 35 to 64 |
| Immigrants | Singapore | 100.0 /100 | #14 | Exceptional 8.9% |
| Bolivians | 100.0 /100 | #15 | Exceptional 8.9% |
| Immigrants | Korea | 100.0 /100 | #16 | Exceptional 9.0% |
| Burmese | 100.0 /100 | #17 | Exceptional 9.2% |
| Soviet Union | 100.0 /100 | #18 | Exceptional 9.2% |
| Immigrants | Venezuela | 100.0 /100 | #19 | Exceptional 9.3% |
| Immigrants | Argentina | 100.0 /100 | #20 | Exceptional 9.3% |
| Okinawans | 100.0 /100 | #21 | Exceptional 9.4% |
| Cypriots | 100.0 /100 | #22 | Exceptional 9.4% |
| Argentineans | 100.0 /100 | #23 | Exceptional 9.4% |
| Asians | 100.0 /100 | #24 | Exceptional 9.4% |
| Venezuelans | 100.0 /100 | #25 | Exceptional 9.4% |
| Immigrants | Sri Lanka | 100.0 /100 | #26 | Exceptional 9.5% |
| Immigrants | Asia | 100.0 /100 | #27 | Exceptional 9.5% |
| Immigrants | Pakistan | 100.0 /100 | #28 | Exceptional 9.5% |
Demographics Similar to Shoshone by Disability Age 35 to 64
In terms of disability age 35 to 64, the demographic groups most similar to Shoshone are Alaska Native (14.5%, a difference of 0.020%), Osage (14.5%, a difference of 0.21%), Iroquois (14.4%, a difference of 0.76%), Crow (14.6%, a difference of 1.1%), and Ottawa (14.6%, a difference of 1.2%).
| Demographics | Rating | Rank | Disability Age 35 to 64 |
| Blackfeet | 0.0 /100 | #307 | Tragic 14.1% |
| Inupiat | 0.0 /100 | #308 | Tragic 14.1% |
| Cree | 0.0 /100 | #309 | Tragic 14.1% |
| Cape Verdeans | 0.0 /100 | #310 | Tragic 14.1% |
| Immigrants | Azores | 0.0 /100 | #311 | Tragic 14.3% |
| Paiute | 0.0 /100 | #312 | Tragic 14.3% |
| Iroquois | 0.0 /100 | #313 | Tragic 14.4% |
| Shoshone | 0.0 /100 | #314 | Tragic 14.5% |
| Alaska Natives | 0.0 /100 | #315 | Tragic 14.5% |
| Osage | 0.0 /100 | #316 | Tragic 14.5% |
| Crow | 0.0 /100 | #317 | Tragic 14.6% |
| Ottawa | 0.0 /100 | #318 | Tragic 14.6% |
| Immigrants | Cabo Verde | 0.0 /100 | #319 | Tragic 14.7% |
| Blacks/African Americans | 0.0 /100 | #320 | Tragic 14.7% |
| Comanche | 0.0 /100 | #321 | Tragic 14.7% |