Filipino vs Immigrants from Ghana Hearing Disability
COMPARE
Filipino
Immigrants from Ghana
Hearing Disability
Hearing Disability Comparison
Filipinos
Immigrants from Ghana
2.6%
HEARING DISABILITY
99.6/ 100
METRIC RATING
33rd/ 347
METRIC RANK
2.6%
HEARING DISABILITY
99.8/ 100
METRIC RATING
24th/ 347
METRIC RANK
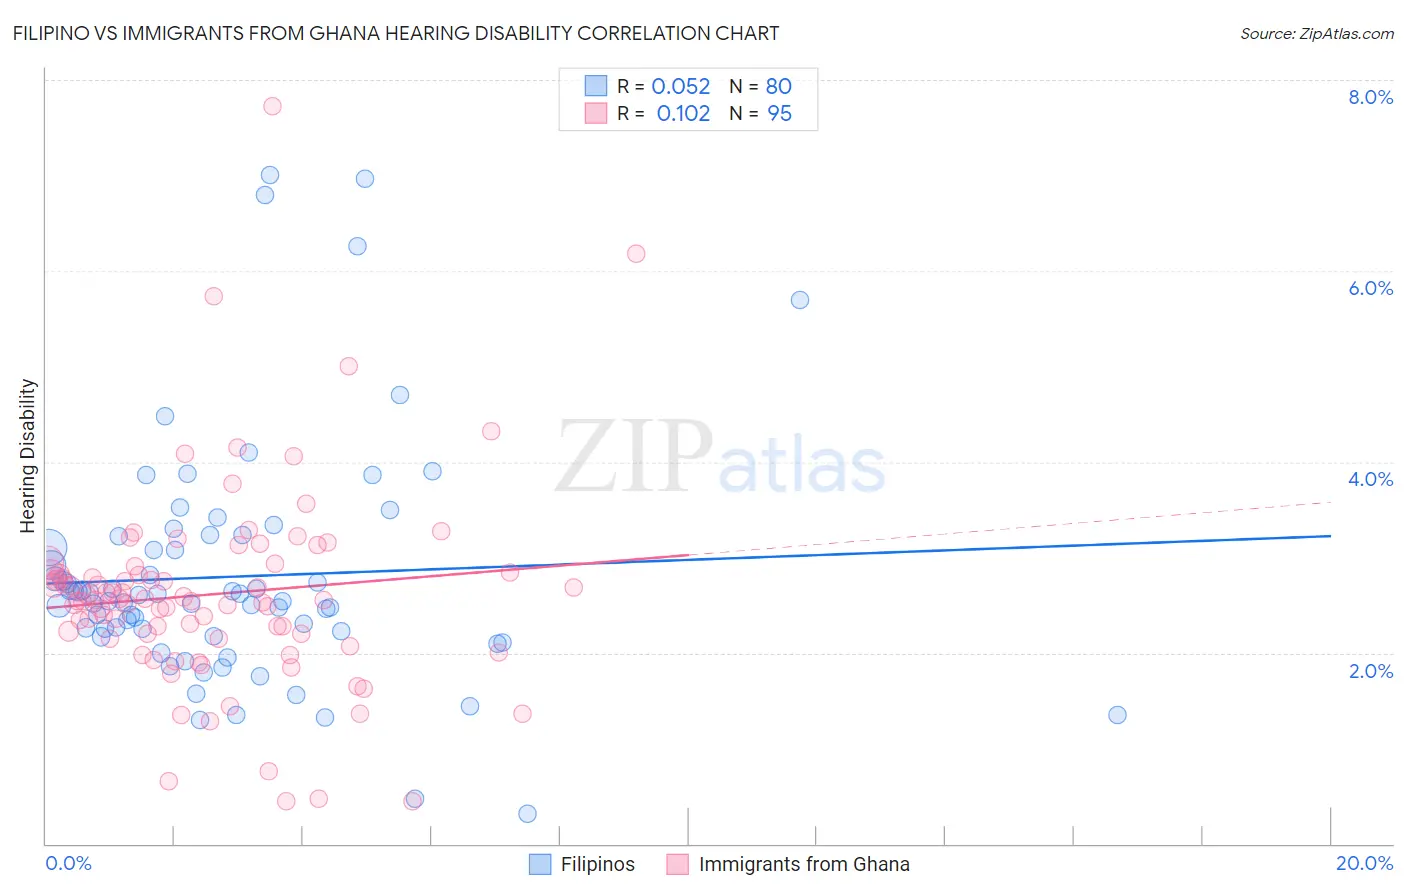
Filipino vs Immigrants from Ghana Hearing Disability Correlation Chart
The statistical analysis conducted on geographies consisting of 254,308,398 people shows a slight positive correlation between the proportion of Filipinos and percentage of population with hearing disability in the United States with a correlation coefficient (R) of 0.052 and weighted average of 2.6%. Similarly, the statistical analysis conducted on geographies consisting of 199,883,907 people shows a poor positive correlation between the proportion of Immigrants from Ghana and percentage of population with hearing disability in the United States with a correlation coefficient (R) of 0.102 and weighted average of 2.6%, a difference of 1.3%.
Hearing Disability Correlation Summary
| Measurement | Filipino | Immigrants from Ghana |
| Minimum | 0.31% | 0.44% |
| Maximum | 7.0% | 7.7% |
| Range | 6.7% | 7.3% |
| Mean | 2.8% | 2.6% |
| Median | 2.6% | 2.6% |
| Interquartile 25% (IQ1) | 2.2% | 2.2% |
| Interquartile 75% (IQ3) | 3.2% | 2.8% |
| Interquartile Range (IQR) | 0.96% | 0.69% |
| Standard Deviation (Sample) | 1.3% | 1.1% |
| Standard Deviation (Population) | 1.2% | 1.1% |
Demographics Similar to Filipinos and Immigrants from Ghana by Hearing Disability
In terms of hearing disability, the demographic groups most similar to Filipinos are Immigrants from Pakistan (2.6%, a difference of 0.040%), Salvadoran (2.6%, a difference of 0.16%), Immigrants from Venezuela (2.6%, a difference of 0.26%), Okinawan (2.6%, a difference of 0.39%), and Immigrants from Cameroon (2.6%, a difference of 0.40%). Similarly, the demographic groups most similar to Immigrants from Ghana are Immigrants from Nigeria (2.6%, a difference of 0.25%), Immigrants from El Salvador (2.6%, a difference of 0.40%), Immigrants from Senegal (2.6%, a difference of 0.41%), Immigrants from South Central Asia (2.6%, a difference of 0.45%), and Immigrants from Sierra Leone (2.6%, a difference of 0.75%).
| Demographics | Rating | Rank | Hearing Disability |
| Dominicans | 99.8 /100 | #18 | Exceptional 2.5% |
| Thais | 99.8 /100 | #19 | Exceptional 2.5% |
| Immigrants | Bolivia | 99.8 /100 | #20 | Exceptional 2.5% |
| Ghanaians | 99.8 /100 | #21 | Exceptional 2.5% |
| Immigrants | Sierra Leone | 99.8 /100 | #22 | Exceptional 2.6% |
| Immigrants | Nigeria | 99.8 /100 | #23 | Exceptional 2.6% |
| Immigrants | Ghana | 99.8 /100 | #24 | Exceptional 2.6% |
| Immigrants | El Salvador | 99.7 /100 | #25 | Exceptional 2.6% |
| Immigrants | Senegal | 99.7 /100 | #26 | Exceptional 2.6% |
| Immigrants | South Central Asia | 99.7 /100 | #27 | Exceptional 2.6% |
| Immigrants | Haiti | 99.7 /100 | #28 | Exceptional 2.6% |
| Bolivians | 99.7 /100 | #29 | Exceptional 2.6% |
| Immigrants | Caribbean | 99.7 /100 | #30 | Exceptional 2.6% |
| Immigrants | Cameroon | 99.7 /100 | #31 | Exceptional 2.6% |
| Immigrants | Venezuela | 99.7 /100 | #32 | Exceptional 2.6% |
| Filipinos | 99.6 /100 | #33 | Exceptional 2.6% |
| Immigrants | Pakistan | 99.6 /100 | #34 | Exceptional 2.6% |
| Salvadorans | 99.6 /100 | #35 | Exceptional 2.6% |
| Okinawans | 99.6 /100 | #36 | Exceptional 2.6% |
| Immigrants | Western Africa | 99.6 /100 | #37 | Exceptional 2.6% |
| Immigrants | Jamaica | 99.5 /100 | #38 | Exceptional 2.6% |