Greek vs Immigrants from Lebanon 1st Grade
COMPARE
Greek
Immigrants from Lebanon
1st Grade
1st Grade Comparison
Greeks
Immigrants from Lebanon
98.4%
1ST GRADE
99.7/ 100
METRIC RATING
64th/ 347
METRIC RANK
97.8%
1ST GRADE
20.1/ 100
METRIC RATING
201st/ 347
METRIC RANK
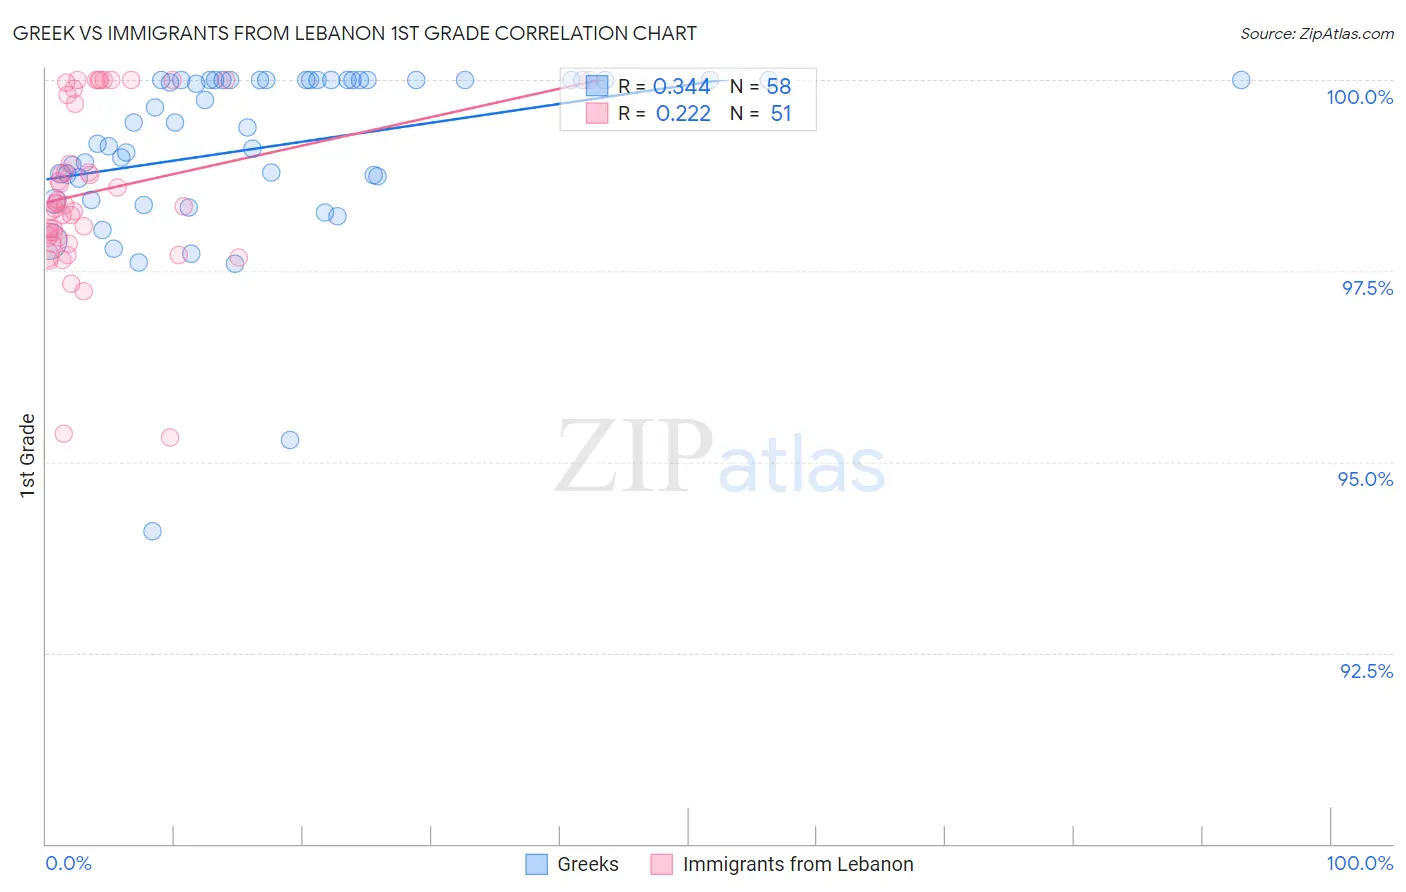
Greek vs Immigrants from Lebanon 1st Grade Correlation Chart
The statistical analysis conducted on geographies consisting of 482,775,358 people shows a mild positive correlation between the proportion of Greeks and percentage of population with at least 1st grade education in the United States with a correlation coefficient (R) of 0.344 and weighted average of 98.4%. Similarly, the statistical analysis conducted on geographies consisting of 217,102,284 people shows a weak positive correlation between the proportion of Immigrants from Lebanon and percentage of population with at least 1st grade education in the United States with a correlation coefficient (R) of 0.222 and weighted average of 97.8%, a difference of 0.56%.
1st Grade Correlation Summary
| Measurement | Greek | Immigrants from Lebanon |
| Minimum | 94.1% | 95.3% |
| Maximum | 100.0% | 100.0% |
| Range | 5.9% | 4.7% |
| Mean | 99.1% | 98.5% |
| Median | 99.4% | 98.4% |
| Interquartile 25% (IQ1) | 98.7% | 97.9% |
| Interquartile 75% (IQ3) | 100.0% | 99.8% |
| Interquartile Range (IQR) | 1.3% | 1.9% |
| Standard Deviation (Sample) | 1.2% | 1.1% |
| Standard Deviation (Population) | 1.1% | 1.1% |
Similar Demographics by 1st Grade
Demographics Similar to Greeks by 1st Grade
In terms of 1st grade, the demographic groups most similar to Greeks are Bulgarian (98.4%, a difference of 0.0%), Slavic (98.4%, a difference of 0.0%), Immigrants from North America (98.4%, a difference of 0.0%), Austrian (98.4%, a difference of 0.010%), and New Zealander (98.4%, a difference of 0.010%).
| Demographics | Rating | Rank | 1st Grade |
| Austrians | 99.8 /100 | #57 | Exceptional 98.4% |
| New Zealanders | 99.7 /100 | #58 | Exceptional 98.4% |
| Creek | 99.7 /100 | #59 | Exceptional 98.4% |
| Immigrants | Canada | 99.7 /100 | #60 | Exceptional 98.4% |
| Bulgarians | 99.7 /100 | #61 | Exceptional 98.4% |
| Slavs | 99.7 /100 | #62 | Exceptional 98.4% |
| Immigrants | North America | 99.7 /100 | #63 | Exceptional 98.4% |
| Greeks | 99.7 /100 | #64 | Exceptional 98.4% |
| Maltese | 99.7 /100 | #65 | Exceptional 98.4% |
| Canadians | 99.6 /100 | #66 | Exceptional 98.3% |
| Immigrants | Austria | 99.6 /100 | #67 | Exceptional 98.3% |
| Immigrants | Northern Europe | 99.6 /100 | #68 | Exceptional 98.3% |
| Chickasaw | 99.6 /100 | #69 | Exceptional 98.3% |
| Russians | 99.6 /100 | #70 | Exceptional 98.3% |
| Serbians | 99.6 /100 | #71 | Exceptional 98.3% |
Demographics Similar to Immigrants from Lebanon by 1st Grade
In terms of 1st grade, the demographic groups most similar to Immigrants from Lebanon are Immigrants from Ukraine (97.8%, a difference of 0.0%), Tohono O'odham (97.8%, a difference of 0.010%), Immigrants from Egypt (97.8%, a difference of 0.010%), Immigrants from Southern Europe (97.8%, a difference of 0.010%), and Immigrants from Uganda (97.8%, a difference of 0.010%).
| Demographics | Rating | Rank | 1st Grade |
| Mongolians | 29.2 /100 | #194 | Fair 97.9% |
| Hawaiians | 28.8 /100 | #195 | Fair 97.9% |
| Immigrants | Kenya | 26.3 /100 | #196 | Fair 97.8% |
| Guamanians/Chamorros | 26.2 /100 | #197 | Fair 97.8% |
| Yuman | 24.4 /100 | #198 | Fair 97.8% |
| Tohono O'odham | 23.2 /100 | #199 | Fair 97.8% |
| Immigrants | Egypt | 22.6 /100 | #200 | Fair 97.8% |
| Immigrants | Lebanon | 20.1 /100 | #201 | Fair 97.8% |
| Immigrants | Ukraine | 19.2 /100 | #202 | Poor 97.8% |
| Immigrants | Southern Europe | 18.2 /100 | #203 | Poor 97.8% |
| Immigrants | Uganda | 18.2 /100 | #204 | Poor 97.8% |
| Immigrants | Chile | 17.7 /100 | #205 | Poor 97.8% |
| Immigrants | Albania | 17.3 /100 | #206 | Poor 97.8% |
| Africans | 16.5 /100 | #207 | Poor 97.8% |
| Immigrants | Northern Africa | 12.0 /100 | #208 | Poor 97.8% |