Immigrants from Nicaragua vs Uruguayan Vision Disability
COMPARE
Immigrants from Nicaragua
Uruguayan
Vision Disability
Vision Disability Comparison
Immigrants from Nicaragua
Uruguayans
2.3%
VISION DISABILITY
0.6/ 100
METRIC RATING
243rd/ 347
METRIC RANK
2.2%
VISION DISABILITY
42.7/ 100
METRIC RATING
180th/ 347
METRIC RANK
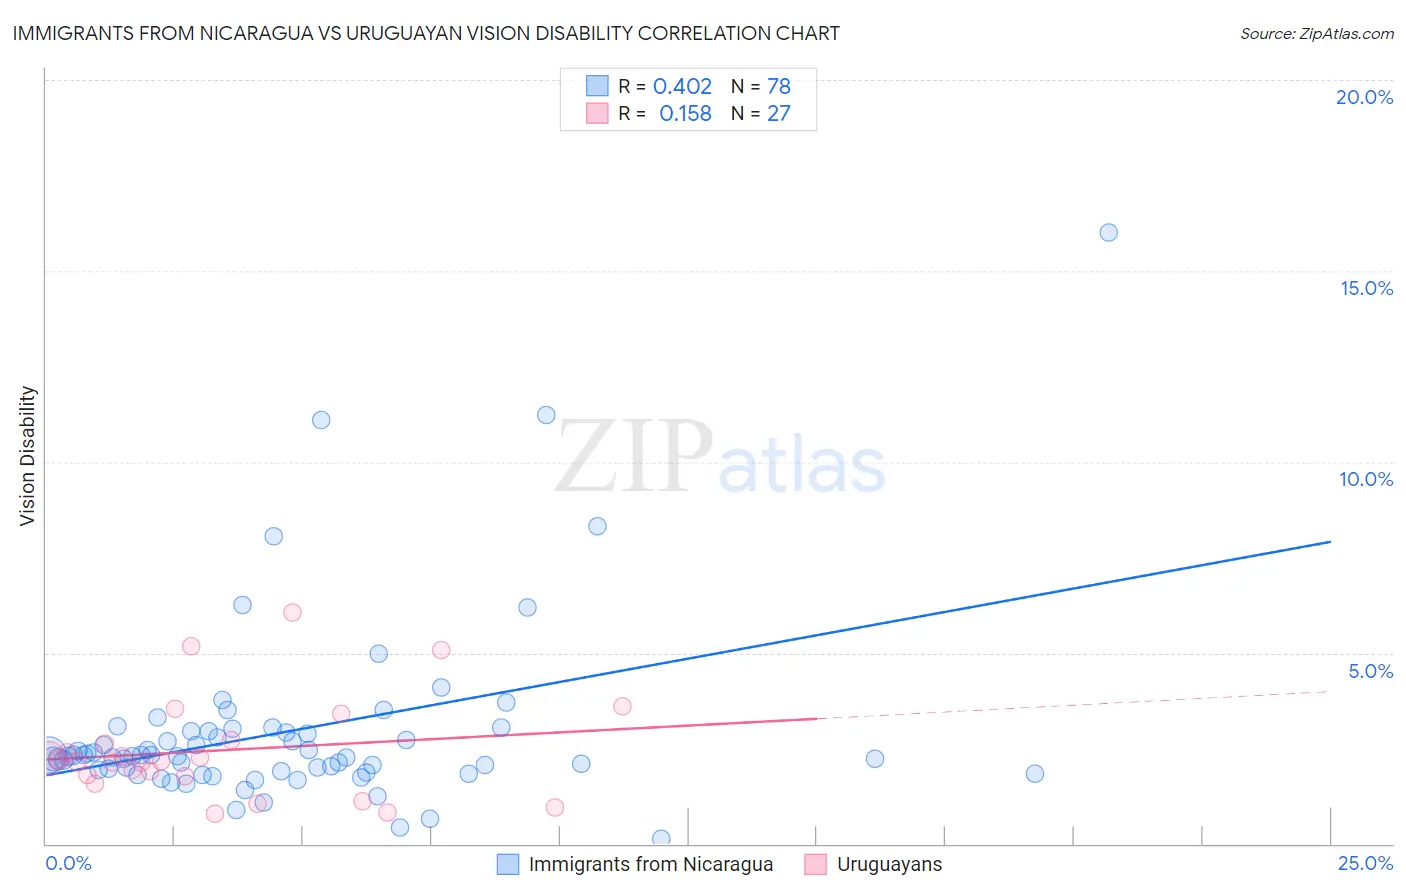
Immigrants from Nicaragua vs Uruguayan Vision Disability Correlation Chart
The statistical analysis conducted on geographies consisting of 236,271,642 people shows a moderate positive correlation between the proportion of Immigrants from Nicaragua and percentage of population with vision disability in the United States with a correlation coefficient (R) of 0.402 and weighted average of 2.3%. Similarly, the statistical analysis conducted on geographies consisting of 144,772,408 people shows a poor positive correlation between the proportion of Uruguayans and percentage of population with vision disability in the United States with a correlation coefficient (R) of 0.158 and weighted average of 2.2%, a difference of 7.5%.
Vision Disability Correlation Summary
| Measurement | Immigrants from Nicaragua | Uruguayan |
| Minimum | 0.13% | 0.80% |
| Maximum | 16.0% | 6.1% |
| Range | 15.9% | 5.3% |
| Mean | 2.9% | 2.4% |
| Median | 2.3% | 2.1% |
| Interquartile 25% (IQ1) | 1.9% | 1.8% |
| Interquartile 75% (IQ3) | 2.9% | 2.7% |
| Interquartile Range (IQR) | 1.0% | 0.93% |
| Standard Deviation (Sample) | 2.4% | 1.3% |
| Standard Deviation (Population) | 2.4% | 1.3% |
Similar Demographics by Vision Disability
Demographics Similar to Immigrants from Nicaragua by Vision Disability
In terms of vision disability, the demographic groups most similar to Immigrants from Nicaragua are Immigrants from West Indies (2.3%, a difference of 0.0%), Alsatian (2.3%, a difference of 0.090%), French (2.3%, a difference of 0.24%), Guatemalan (2.3%, a difference of 0.28%), and Subsaharan African (2.3%, a difference of 0.30%).
| Demographics | Rating | Rank | Vision Disability |
| Immigrants | Congo | 1.4 /100 | #236 | Tragic 2.3% |
| Immigrants | Portugal | 1.4 /100 | #237 | Tragic 2.3% |
| Immigrants | Cambodia | 1.1 /100 | #238 | Tragic 2.3% |
| English | 1.1 /100 | #239 | Tragic 2.3% |
| Panamanians | 0.9 /100 | #240 | Tragic 2.3% |
| Malaysians | 0.9 /100 | #241 | Tragic 2.3% |
| Immigrants | Panama | 0.8 /100 | #242 | Tragic 2.3% |
| Immigrants | Nicaragua | 0.6 /100 | #243 | Tragic 2.3% |
| Immigrants | West Indies | 0.6 /100 | #244 | Tragic 2.3% |
| Alsatians | 0.6 /100 | #245 | Tragic 2.3% |
| French | 0.5 /100 | #246 | Tragic 2.3% |
| Guatemalans | 0.5 /100 | #247 | Tragic 2.3% |
| Sub-Saharan Africans | 0.5 /100 | #248 | Tragic 2.3% |
| Liberians | 0.5 /100 | #249 | Tragic 2.3% |
| Bangladeshis | 0.5 /100 | #250 | Tragic 2.3% |
Demographics Similar to Uruguayans by Vision Disability
In terms of vision disability, the demographic groups most similar to Uruguayans are Immigrants from Western Europe (2.2%, a difference of 0.10%), Immigrants from North America (2.2%, a difference of 0.12%), Costa Rican (2.2%, a difference of 0.13%), Immigrants from Oceania (2.2%, a difference of 0.16%), and Slavic (2.2%, a difference of 0.21%).
| Demographics | Rating | Rank | Vision Disability |
| Scandinavians | 50.0 /100 | #173 | Average 2.2% |
| Immigrants | Canada | 50.0 /100 | #174 | Average 2.2% |
| Immigrants | Fiji | 47.6 /100 | #175 | Average 2.2% |
| Yugoslavians | 46.5 /100 | #176 | Average 2.2% |
| Slavs | 46.0 /100 | #177 | Average 2.2% |
| Immigrants | Oceania | 45.1 /100 | #178 | Average 2.2% |
| Immigrants | North America | 44.5 /100 | #179 | Average 2.2% |
| Uruguayans | 42.7 /100 | #180 | Average 2.2% |
| Immigrants | Western Europe | 41.1 /100 | #181 | Average 2.2% |
| Costa Ricans | 40.7 /100 | #182 | Average 2.2% |
| Immigrants | Burma/Myanmar | 37.9 /100 | #183 | Fair 2.2% |
| Moroccans | 35.4 /100 | #184 | Fair 2.2% |
| Immigrants | Middle Africa | 33.5 /100 | #185 | Fair 2.2% |
| Native Hawaiians | 33.3 /100 | #186 | Fair 2.2% |
| Immigrants | St. Vincent and the Grenadines | 30.3 /100 | #187 | Fair 2.2% |