Ghanaian vs Pakistani Unemployment
COMPARE
Ghanaian
Pakistani
Unemployment
Unemployment Comparison
Ghanaians
Pakistanis
6.0%
UNEMPLOYMENT
0.0/ 100
METRIC RATING
278th/ 347
METRIC RANK
5.1%
UNEMPLOYMENT
85.3/ 100
METRIC RATING
139th/ 347
METRIC RANK
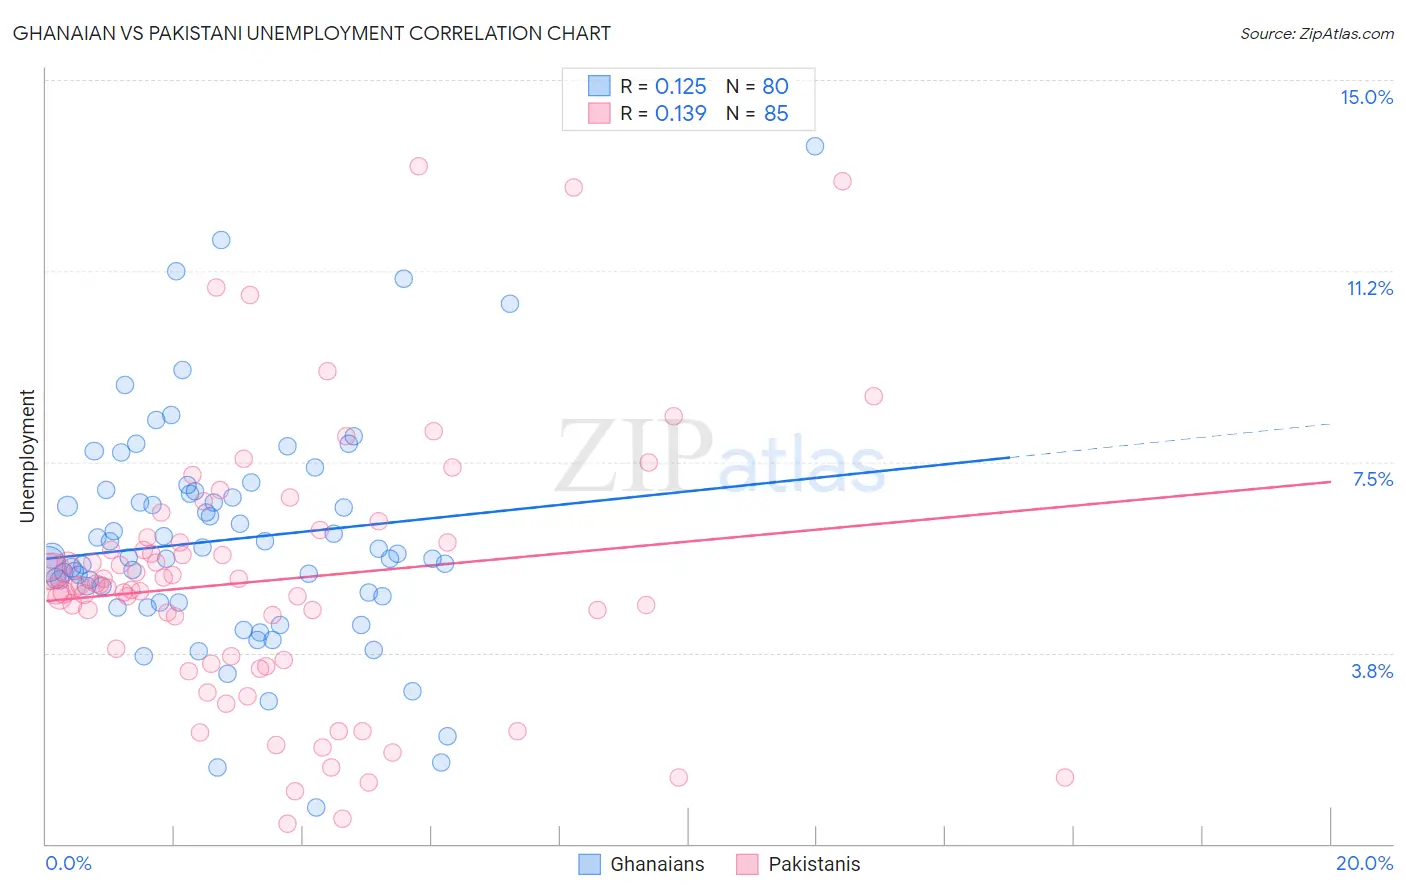
Ghanaian vs Pakistani Unemployment Correlation Chart
The statistical analysis conducted on geographies consisting of 190,676,370 people shows a poor positive correlation between the proportion of Ghanaians and unemployment in the United States with a correlation coefficient (R) of 0.125 and weighted average of 6.0%. Similarly, the statistical analysis conducted on geographies consisting of 335,152,047 people shows a poor positive correlation between the proportion of Pakistanis and unemployment in the United States with a correlation coefficient (R) of 0.139 and weighted average of 5.1%, a difference of 17.2%.
Unemployment Correlation Summary
| Measurement | Ghanaian | Pakistani |
| Minimum | 0.70% | 0.40% |
| Maximum | 13.7% | 13.3% |
| Range | 13.0% | 12.9% |
| Mean | 6.0% | 5.2% |
| Median | 5.6% | 5.0% |
| Interquartile 25% (IQ1) | 4.8% | 3.6% |
| Interquartile 75% (IQ3) | 6.9% | 6.0% |
| Interquartile Range (IQR) | 2.1% | 2.4% |
| Standard Deviation (Sample) | 2.2% | 2.6% |
| Standard Deviation (Population) | 2.2% | 2.6% |
Similar Demographics by Unemployment
Demographics Similar to Ghanaians by Unemployment
In terms of unemployment, the demographic groups most similar to Ghanaians are Armenian (6.0%, a difference of 0.29%), Immigrants from Mexico (6.0%, a difference of 0.43%), Immigrants from Western Africa (6.0%, a difference of 0.43%), Immigrants from Central America (6.0%, a difference of 0.64%), and Immigrants from Latin America (5.9%, a difference of 0.93%).
| Demographics | Rating | Rank | Unemployment |
| Mexicans | 0.1 /100 | #271 | Tragic 5.9% |
| Hispanics or Latinos | 0.0 /100 | #272 | Tragic 5.9% |
| Immigrants | Fiji | 0.0 /100 | #273 | Tragic 5.9% |
| Bahamians | 0.0 /100 | #274 | Tragic 5.9% |
| Immigrants | Latin America | 0.0 /100 | #275 | Tragic 5.9% |
| Immigrants | Central America | 0.0 /100 | #276 | Tragic 6.0% |
| Armenians | 0.0 /100 | #277 | Tragic 6.0% |
| Ghanaians | 0.0 /100 | #278 | Tragic 6.0% |
| Immigrants | Mexico | 0.0 /100 | #279 | Tragic 6.0% |
| Immigrants | Western Africa | 0.0 /100 | #280 | Tragic 6.0% |
| Africans | 0.0 /100 | #281 | Tragic 6.1% |
| Immigrants | Azores | 0.0 /100 | #282 | Tragic 6.1% |
| Immigrants | Ghana | 0.0 /100 | #283 | Tragic 6.1% |
| Aleuts | 0.0 /100 | #284 | Tragic 6.1% |
| Immigrants | Senegal | 0.0 /100 | #285 | Tragic 6.1% |
Demographics Similar to Pakistanis by Unemployment
In terms of unemployment, the demographic groups most similar to Pakistanis are Immigrants from Saudi Arabia (5.1%, a difference of 0.040%), Immigrants from Hungary (5.1%, a difference of 0.040%), Immigrants from Burma/Myanmar (5.1%, a difference of 0.12%), Immigrants from Spain (5.1%, a difference of 0.12%), and Immigrants from Europe (5.1%, a difference of 0.13%).
| Demographics | Rating | Rank | Unemployment |
| Immigrants | Ethiopia | 86.7 /100 | #132 | Excellent 5.1% |
| Immigrants | Jordan | 86.6 /100 | #133 | Excellent 5.1% |
| Immigrants | Europe | 86.3 /100 | #134 | Excellent 5.1% |
| Immigrants | Burma/Myanmar | 86.2 /100 | #135 | Excellent 5.1% |
| Immigrants | Spain | 86.2 /100 | #136 | Excellent 5.1% |
| Immigrants | Saudi Arabia | 85.6 /100 | #137 | Excellent 5.1% |
| Immigrants | Hungary | 85.6 /100 | #138 | Excellent 5.1% |
| Pakistanis | 85.3 /100 | #139 | Excellent 5.1% |
| Immigrants | Denmark | 84.3 /100 | #140 | Excellent 5.1% |
| Palestinians | 83.4 /100 | #141 | Excellent 5.1% |
| Immigrants | Pakistan | 83.2 /100 | #142 | Excellent 5.1% |
| Immigrants | Chile | 82.8 /100 | #143 | Excellent 5.1% |
| Indonesians | 82.3 /100 | #144 | Excellent 5.1% |
| Immigrants | Norway | 81.8 /100 | #145 | Excellent 5.1% |
| Immigrants | Asia | 81.8 /100 | #146 | Excellent 5.1% |