Immigrants from Poland vs Pakistani Cognitive Disability
COMPARE
Immigrants from Poland
Pakistani
Cognitive Disability
Cognitive Disability Comparison
Immigrants from Poland
Pakistanis
16.1%
COGNITIVE DISABILITY
100.0/ 100
METRIC RATING
8th/ 347
METRIC RANK
17.3%
COGNITIVE DISABILITY
43.9/ 100
METRIC RATING
180th/ 347
METRIC RANK
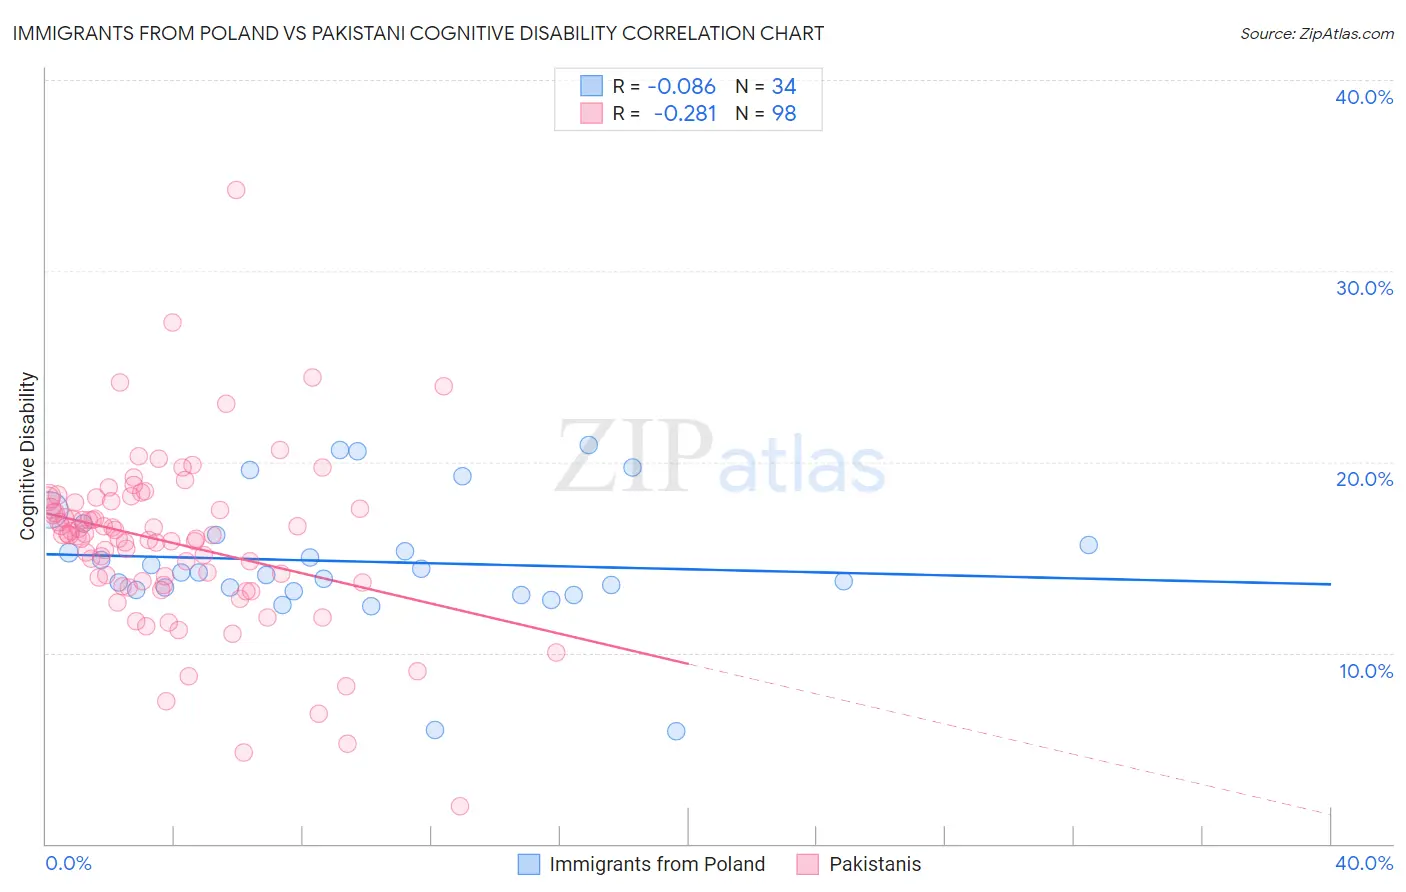
Immigrants from Poland vs Pakistani Cognitive Disability Correlation Chart
The statistical analysis conducted on geographies consisting of 304,838,376 people shows a slight negative correlation between the proportion of Immigrants from Poland and percentage of population with cognitive disability in the United States with a correlation coefficient (R) of -0.086 and weighted average of 16.1%. Similarly, the statistical analysis conducted on geographies consisting of 335,302,267 people shows a weak negative correlation between the proportion of Pakistanis and percentage of population with cognitive disability in the United States with a correlation coefficient (R) of -0.281 and weighted average of 17.3%, a difference of 7.2%.
Cognitive Disability Correlation Summary
| Measurement | Immigrants from Poland | Pakistani |
| Minimum | 5.9% | 2.0% |
| Maximum | 20.9% | 34.2% |
| Range | 15.0% | 32.2% |
| Mean | 14.8% | 15.8% |
| Median | 14.2% | 16.2% |
| Interquartile 25% (IQ1) | 13.3% | 13.7% |
| Interquartile 75% (IQ3) | 16.2% | 17.9% |
| Interquartile Range (IQR) | 2.9% | 4.2% |
| Standard Deviation (Sample) | 3.4% | 4.5% |
| Standard Deviation (Population) | 3.3% | 4.4% |
Similar Demographics by Cognitive Disability
Demographics Similar to Immigrants from Poland by Cognitive Disability
In terms of cognitive disability, the demographic groups most similar to Immigrants from Poland are Immigrants from Ireland (16.1%, a difference of 0.020%), Thai (16.1%, a difference of 0.13%), Assyrian/Chaldean/Syriac (16.2%, a difference of 0.32%), Immigrants from Scotland (16.2%, a difference of 0.36%), and Immigrants from Czechoslovakia (16.2%, a difference of 0.45%).
| Demographics | Rating | Rank | Cognitive Disability |
| Immigrants | Taiwan | 100.0 /100 | #1 | Exceptional 15.7% |
| Immigrants | India | 100.0 /100 | #2 | Exceptional 15.9% |
| Chinese | 100.0 /100 | #3 | Exceptional 15.9% |
| Immigrants | Lithuania | 100.0 /100 | #4 | Exceptional 16.0% |
| Immigrants | Hong Kong | 100.0 /100 | #5 | Exceptional 16.0% |
| Thais | 100.0 /100 | #6 | Exceptional 16.1% |
| Immigrants | Ireland | 100.0 /100 | #7 | Exceptional 16.1% |
| Immigrants | Poland | 100.0 /100 | #8 | Exceptional 16.1% |
| Assyrians/Chaldeans/Syriacs | 100.0 /100 | #9 | Exceptional 16.2% |
| Immigrants | Scotland | 100.0 /100 | #10 | Exceptional 16.2% |
| Immigrants | Czechoslovakia | 100.0 /100 | #11 | Exceptional 16.2% |
| Maltese | 100.0 /100 | #12 | Exceptional 16.2% |
| Lithuanians | 100.0 /100 | #13 | Exceptional 16.3% |
| Immigrants | Austria | 100.0 /100 | #14 | Exceptional 16.3% |
| Immigrants | Greece | 100.0 /100 | #15 | Exceptional 16.3% |
Demographics Similar to Pakistanis by Cognitive Disability
In terms of cognitive disability, the demographic groups most similar to Pakistanis are Immigrants from Guyana (17.3%, a difference of 0.030%), Arab (17.3%, a difference of 0.030%), Spaniard (17.3%, a difference of 0.10%), Sioux (17.3%, a difference of 0.13%), and Spanish (17.3%, a difference of 0.14%).
| Demographics | Rating | Rank | Cognitive Disability |
| Immigrants | Northern Africa | 50.2 /100 | #173 | Average 17.3% |
| Laotians | 50.0 /100 | #174 | Average 17.3% |
| Tsimshian | 49.8 /100 | #175 | Average 17.3% |
| Shoshone | 49.2 /100 | #176 | Average 17.3% |
| Ute | 49.1 /100 | #177 | Average 17.3% |
| Spanish | 48.9 /100 | #178 | Average 17.3% |
| Sioux | 48.6 /100 | #179 | Average 17.3% |
| Pakistanis | 43.9 /100 | #180 | Average 17.3% |
| Immigrants | Guyana | 42.9 /100 | #181 | Average 17.3% |
| Arabs | 42.8 /100 | #182 | Average 17.3% |
| Spaniards | 40.3 /100 | #183 | Average 17.3% |
| Crow | 39.1 /100 | #184 | Fair 17.3% |
| Afghans | 38.2 /100 | #185 | Fair 17.3% |
| Cambodians | 35.9 /100 | #186 | Fair 17.3% |
| Immigrants | Fiji | 33.7 /100 | #187 | Fair 17.4% |