Iraqi vs Immigrants from Bolivia Vision Disability
COMPARE
Iraqi
Immigrants from Bolivia
Vision Disability
Vision Disability Comparison
Iraqis
Immigrants from Bolivia
2.1%
VISION DISABILITY
67.7/ 100
METRIC RATING
161st/ 347
METRIC RANK
1.8%
VISION DISABILITY
100.0/ 100
METRIC RATING
15th/ 347
METRIC RANK
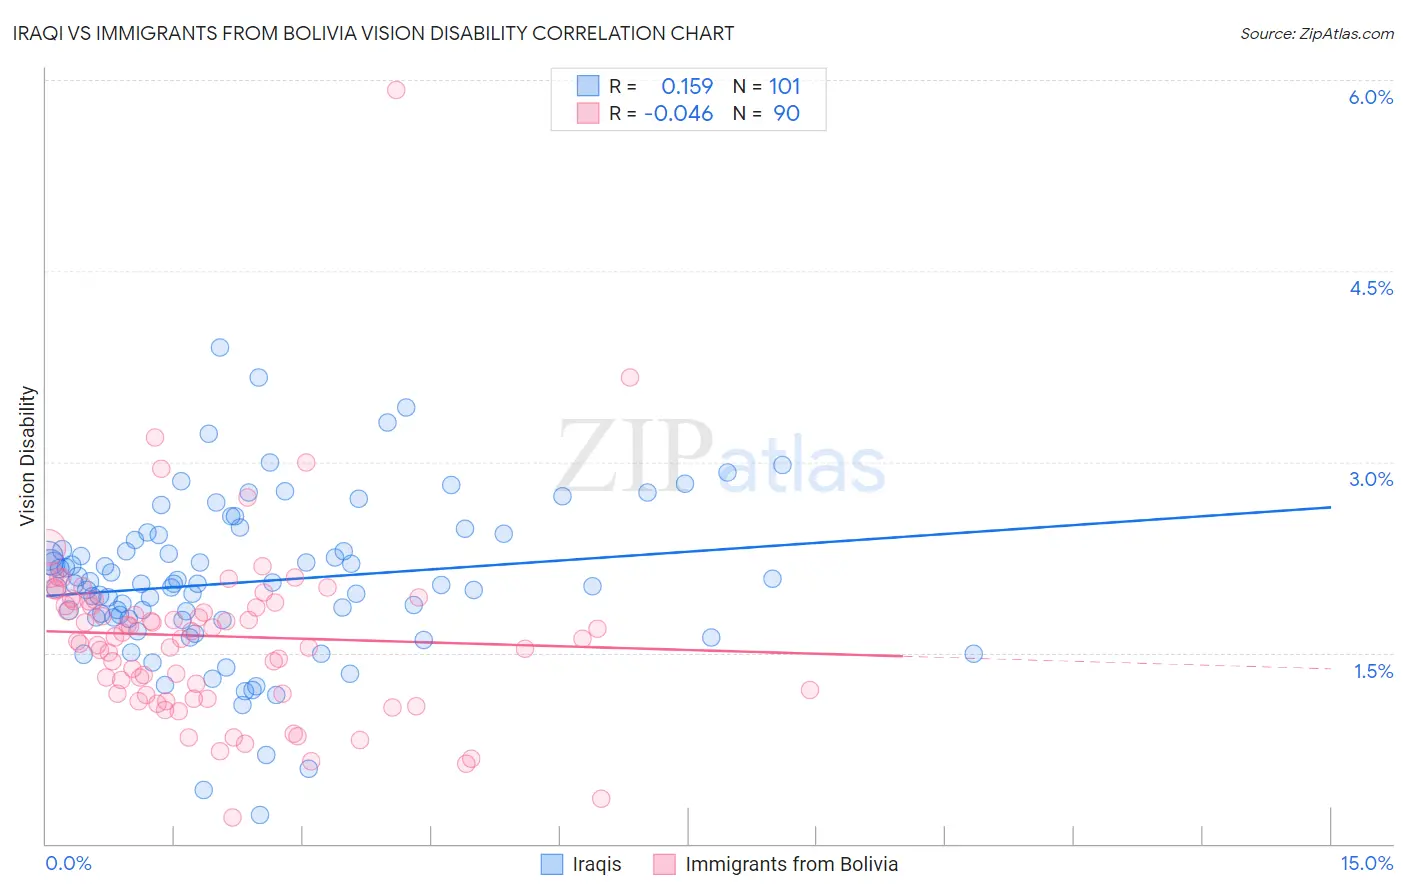
Iraqi vs Immigrants from Bolivia Vision Disability Correlation Chart
The statistical analysis conducted on geographies consisting of 170,621,066 people shows a poor positive correlation between the proportion of Iraqis and percentage of population with vision disability in the United States with a correlation coefficient (R) of 0.159 and weighted average of 2.1%. Similarly, the statistical analysis conducted on geographies consisting of 158,695,494 people shows no correlation between the proportion of Immigrants from Bolivia and percentage of population with vision disability in the United States with a correlation coefficient (R) of -0.046 and weighted average of 1.8%, a difference of 16.3%.
Vision Disability Correlation Summary
| Measurement | Iraqi | Immigrants from Bolivia |
| Minimum | 0.23% | 0.21% |
| Maximum | 3.9% | 5.9% |
| Range | 3.7% | 5.7% |
| Mean | 2.1% | 1.6% |
| Median | 2.0% | 1.6% |
| Interquartile 25% (IQ1) | 1.8% | 1.2% |
| Interquartile 75% (IQ3) | 2.4% | 1.9% |
| Interquartile Range (IQR) | 0.64% | 0.72% |
| Standard Deviation (Sample) | 0.63% | 0.74% |
| Standard Deviation (Population) | 0.63% | 0.74% |
Similar Demographics by Vision Disability
Demographics Similar to Iraqis by Vision Disability
In terms of vision disability, the demographic groups most similar to Iraqis are Hungarian (2.1%, a difference of 0.030%), Austrian (2.1%, a difference of 0.090%), Icelander (2.1%, a difference of 0.12%), South African (2.1%, a difference of 0.15%), and Immigrants from Uzbekistan (2.1%, a difference of 0.16%).
| Demographics | Rating | Rank | Vision Disability |
| Slovenes | 73.6 /100 | #154 | Good 2.1% |
| Immigrants | Colombia | 72.1 /100 | #155 | Good 2.1% |
| Pakistanis | 71.6 /100 | #156 | Good 2.1% |
| Serbians | 70.2 /100 | #157 | Good 2.1% |
| Immigrants | Uzbekistan | 69.9 /100 | #158 | Good 2.1% |
| South Africans | 69.8 /100 | #159 | Good 2.1% |
| Austrians | 69.0 /100 | #160 | Good 2.1% |
| Iraqis | 67.7 /100 | #161 | Good 2.1% |
| Hungarians | 67.4 /100 | #162 | Good 2.1% |
| Icelanders | 66.1 /100 | #163 | Good 2.1% |
| Immigrants | Bangladesh | 65.5 /100 | #164 | Good 2.1% |
| Immigrants | Iraq | 64.8 /100 | #165 | Good 2.1% |
| Immigrants | England | 62.8 /100 | #166 | Good 2.1% |
| Immigrants | Africa | 62.6 /100 | #167 | Good 2.1% |
| Brazilians | 62.2 /100 | #168 | Good 2.1% |
Demographics Similar to Immigrants from Bolivia by Vision Disability
In terms of vision disability, the demographic groups most similar to Immigrants from Bolivia are Immigrants from China (1.8%, a difference of 0.42%), Indian (Asian) (1.8%, a difference of 0.44%), Burmese (1.8%, a difference of 0.45%), Immigrants from Eastern Asia (1.8%, a difference of 0.57%), and Immigrants from Korea (1.8%, a difference of 0.65%).
| Demographics | Rating | Rank | Vision Disability |
| Iranians | 100.0 /100 | #8 | Exceptional 1.8% |
| Immigrants | Singapore | 100.0 /100 | #9 | Exceptional 1.8% |
| Immigrants | Hong Kong | 100.0 /100 | #10 | Exceptional 1.8% |
| Immigrants | Israel | 100.0 /100 | #11 | Exceptional 1.8% |
| Immigrants | Korea | 100.0 /100 | #12 | Exceptional 1.8% |
| Immigrants | Eastern Asia | 100.0 /100 | #13 | Exceptional 1.8% |
| Immigrants | China | 100.0 /100 | #14 | Exceptional 1.8% |
| Immigrants | Bolivia | 100.0 /100 | #15 | Exceptional 1.8% |
| Indians (Asian) | 100.0 /100 | #16 | Exceptional 1.8% |
| Burmese | 100.0 /100 | #17 | Exceptional 1.8% |
| Bolivians | 100.0 /100 | #18 | Exceptional 1.9% |
| Immigrants | Sri Lanka | 100.0 /100 | #19 | Exceptional 1.9% |
| Asians | 100.0 /100 | #20 | Exceptional 1.9% |
| Turks | 100.0 /100 | #21 | Exceptional 1.9% |
| Immigrants | Pakistan | 100.0 /100 | #22 | Exceptional 1.9% |