Ghanaian vs Immigrants from Belgium Unemployment Among Ages 30 to 34 years
COMPARE
Ghanaian
Immigrants from Belgium
Unemployment Among Ages 30 to 34 years
Unemployment Among Ages 30 to 34 years Comparison
Ghanaians
Immigrants from Belgium
6.0%
UNEMPLOYMENT AMONG AGES 30 TO 34 YEARS
0.3/ 100
METRIC RATING
246th/ 347
METRIC RANK
5.1%
UNEMPLOYMENT AMONG AGES 30 TO 34 YEARS
98.7/ 100
METRIC RATING
44th/ 347
METRIC RANK
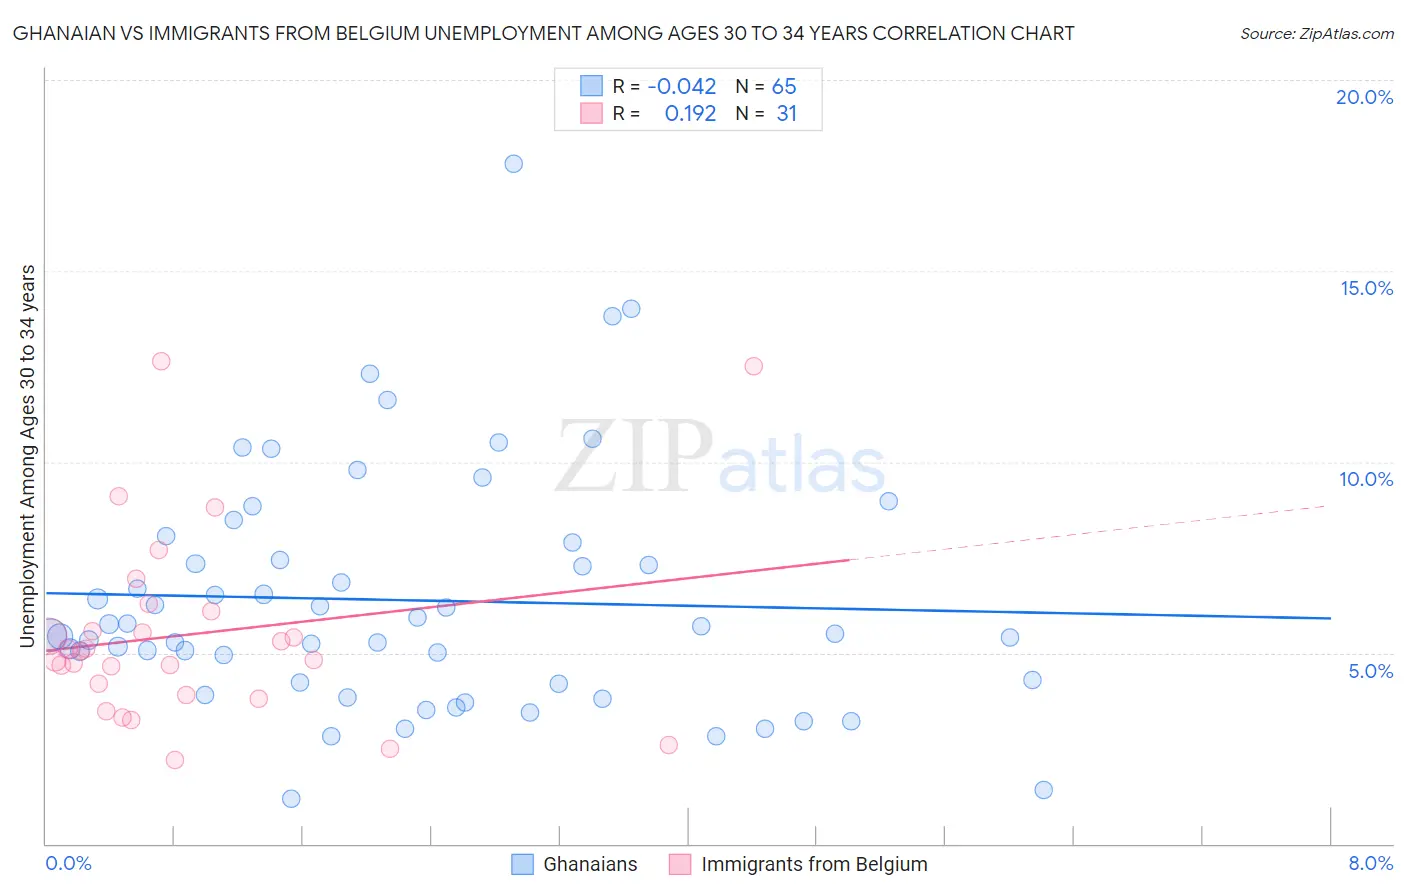
Ghanaian vs Immigrants from Belgium Unemployment Among Ages 30 to 34 years Correlation Chart
The statistical analysis conducted on geographies consisting of 186,889,123 people shows no correlation between the proportion of Ghanaians and unemployment rate among population between the ages 30 and 34 in the United States with a correlation coefficient (R) of -0.042 and weighted average of 6.0%. Similarly, the statistical analysis conducted on geographies consisting of 142,059,872 people shows a poor positive correlation between the proportion of Immigrants from Belgium and unemployment rate among population between the ages 30 and 34 in the United States with a correlation coefficient (R) of 0.192 and weighted average of 5.1%, a difference of 19.0%.
Unemployment Among Ages 30 to 34 years Correlation Summary
| Measurement | Ghanaian | Immigrants from Belgium |
| Minimum | 1.2% | 2.2% |
| Maximum | 17.8% | 12.7% |
| Range | 16.6% | 10.5% |
| Mean | 6.4% | 5.5% |
| Median | 5.5% | 5.1% |
| Interquartile 25% (IQ1) | 4.2% | 3.9% |
| Interquartile 75% (IQ3) | 7.7% | 6.1% |
| Interquartile Range (IQR) | 3.4% | 2.2% |
| Standard Deviation (Sample) | 3.1% | 2.5% |
| Standard Deviation (Population) | 3.1% | 2.4% |
Similar Demographics by Unemployment Among Ages 30 to 34 years
Demographics Similar to Ghanaians by Unemployment Among Ages 30 to 34 years
In terms of unemployment among ages 30 to 34 years, the demographic groups most similar to Ghanaians are Nigerian (6.0%, a difference of 0.060%), Immigrants from Guatemala (6.0%, a difference of 0.070%), Honduran (6.0%, a difference of 0.070%), Immigrants from Honduras (6.0%, a difference of 0.16%), and Subsaharan African (6.0%, a difference of 0.18%).
| Demographics | Rating | Rank | Unemployment Among Ages 30 to 34 years |
| Immigrants | Nigeria | 0.6 /100 | #239 | Tragic 6.0% |
| Salvadorans | 0.5 /100 | #240 | Tragic 6.0% |
| Immigrants | El Salvador | 0.5 /100 | #241 | Tragic 6.0% |
| Guatemalans | 0.4 /100 | #242 | Tragic 6.0% |
| Immigrants | Liberia | 0.4 /100 | #243 | Tragic 6.0% |
| Immigrants | Micronesia | 0.3 /100 | #244 | Tragic 6.0% |
| Sub-Saharan Africans | 0.3 /100 | #245 | Tragic 6.0% |
| Ghanaians | 0.3 /100 | #246 | Tragic 6.0% |
| Nigerians | 0.3 /100 | #247 | Tragic 6.0% |
| Immigrants | Guatemala | 0.3 /100 | #248 | Tragic 6.0% |
| Hondurans | 0.3 /100 | #249 | Tragic 6.0% |
| Immigrants | Honduras | 0.3 /100 | #250 | Tragic 6.0% |
| Tlingit-Haida | 0.2 /100 | #251 | Tragic 6.0% |
| Potawatomi | 0.2 /100 | #252 | Tragic 6.0% |
| Immigrants | Nonimmigrants | 0.2 /100 | #253 | Tragic 6.1% |
Demographics Similar to Immigrants from Belgium by Unemployment Among Ages 30 to 34 years
In terms of unemployment among ages 30 to 34 years, the demographic groups most similar to Immigrants from Belgium are Yugoslavian (5.1%, a difference of 0.030%), Soviet Union (5.0%, a difference of 0.14%), Immigrants from Hong Kong (5.0%, a difference of 0.25%), Immigrants from Congo (5.1%, a difference of 0.33%), and Cypriot (5.1%, a difference of 0.36%).
| Demographics | Rating | Rank | Unemployment Among Ages 30 to 34 years |
| Immigrants | Turkey | 99.0 /100 | #37 | Exceptional 5.0% |
| Sri Lankans | 99.0 /100 | #38 | Exceptional 5.0% |
| Fijians | 99.0 /100 | #39 | Exceptional 5.0% |
| Immigrants | Vietnam | 98.9 /100 | #40 | Exceptional 5.0% |
| Immigrants | Eastern Africa | 98.9 /100 | #41 | Exceptional 5.0% |
| Immigrants | Hong Kong | 98.8 /100 | #42 | Exceptional 5.0% |
| Soviet Union | 98.8 /100 | #43 | Exceptional 5.0% |
| Immigrants | Belgium | 98.7 /100 | #44 | Exceptional 5.1% |
| Yugoslavians | 98.6 /100 | #45 | Exceptional 5.1% |
| Immigrants | Congo | 98.4 /100 | #46 | Exceptional 5.1% |
| Cypriots | 98.4 /100 | #47 | Exceptional 5.1% |
| Assyrians/Chaldeans/Syriacs | 98.4 /100 | #48 | Exceptional 5.1% |
| Immigrants | Malaysia | 98.3 /100 | #49 | Exceptional 5.1% |
| Puget Sound Salish | 98.2 /100 | #50 | Exceptional 5.1% |
| Turks | 98.2 /100 | #51 | Exceptional 5.1% |