German Russian vs Vietnamese Family Poverty
COMPARE
German Russian
Vietnamese
Family Poverty
Family Poverty Comparison
German Russians
Vietnamese
9.4%
FAMILY POVERTY
19.4/ 100
METRIC RATING
203rd/ 347
METRIC RANK
11.5%
FAMILY POVERTY
0.0/ 100
METRIC RATING
287th/ 347
METRIC RANK
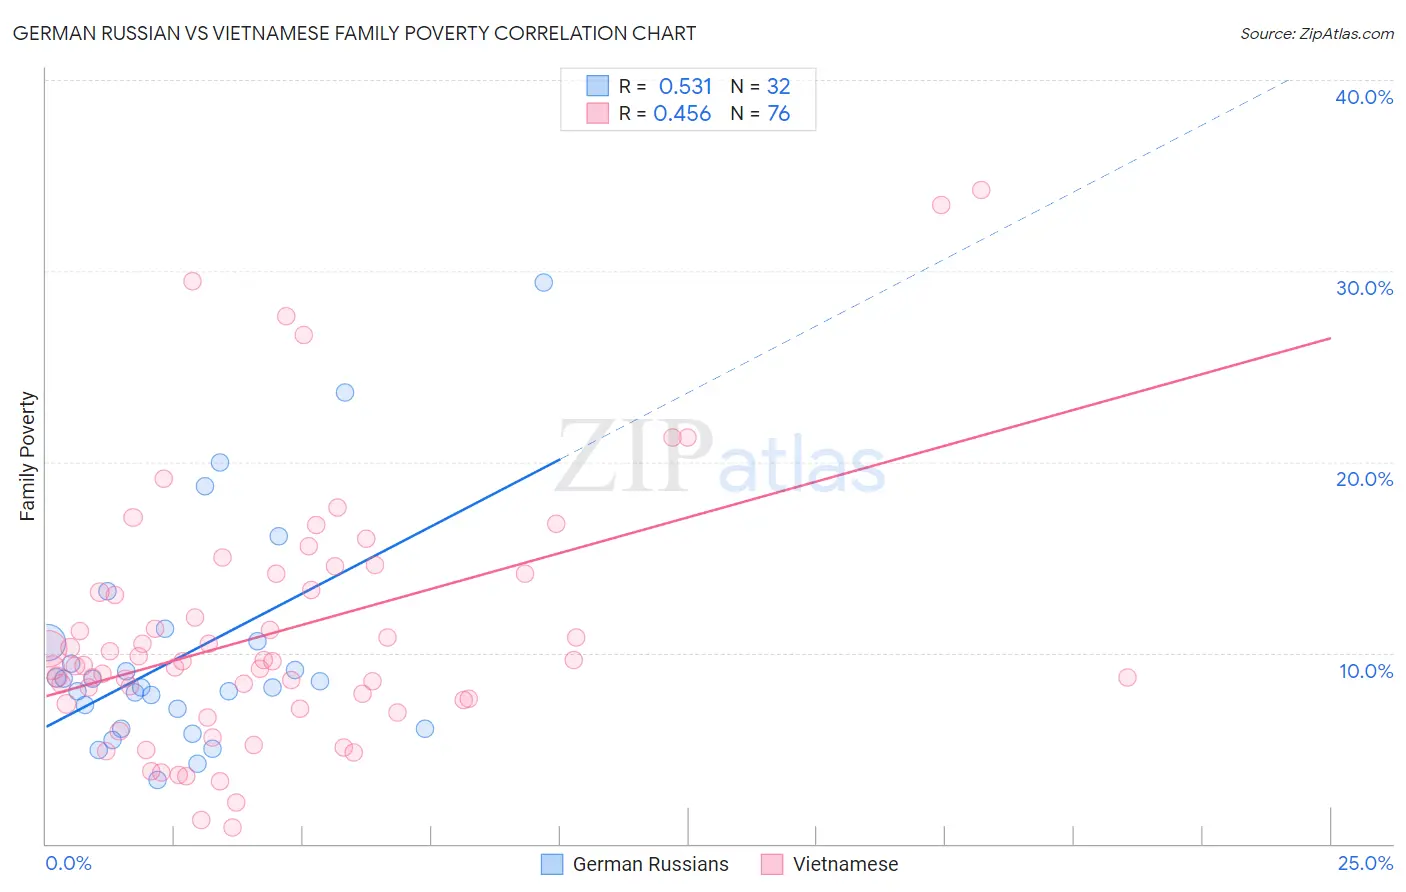
German Russian vs Vietnamese Family Poverty Correlation Chart
The statistical analysis conducted on geographies consisting of 96,398,519 people shows a substantial positive correlation between the proportion of German Russians and poverty level among families in the United States with a correlation coefficient (R) of 0.531 and weighted average of 9.4%. Similarly, the statistical analysis conducted on geographies consisting of 170,550,296 people shows a moderate positive correlation between the proportion of Vietnamese and poverty level among families in the United States with a correlation coefficient (R) of 0.456 and weighted average of 11.5%, a difference of 22.0%.
Family Poverty Correlation Summary
| Measurement | German Russian | Vietnamese |
| Minimum | 3.4% | 0.88% |
| Maximum | 29.4% | 34.2% |
| Range | 26.0% | 33.4% |
| Mean | 10.0% | 11.1% |
| Median | 8.4% | 9.4% |
| Interquartile 25% (IQ1) | 6.5% | 7.4% |
| Interquartile 75% (IQ3) | 10.6% | 13.7% |
| Interquartile Range (IQR) | 4.1% | 6.3% |
| Standard Deviation (Sample) | 5.8% | 6.8% |
| Standard Deviation (Population) | 5.7% | 6.7% |
Similar Demographics by Family Poverty
Demographics Similar to German Russians by Family Poverty
In terms of family poverty, the demographic groups most similar to German Russians are Immigrants from Sierra Leone (9.4%, a difference of 0.040%), Immigrants from Lebanon (9.4%, a difference of 0.10%), Immigrants from Portugal (9.4%, a difference of 0.21%), Aleut (9.5%, a difference of 0.29%), and Immigrants from South America (9.5%, a difference of 0.30%).
| Demographics | Rating | Rank | Family Poverty |
| Immigrants | Venezuela | 26.1 /100 | #196 | Fair 9.3% |
| Immigrants | Colombia | 24.4 /100 | #197 | Fair 9.3% |
| Iraqis | 24.2 /100 | #198 | Fair 9.3% |
| Spaniards | 22.8 /100 | #199 | Fair 9.4% |
| Immigrants | Costa Rica | 21.7 /100 | #200 | Fair 9.4% |
| Immigrants | Portugal | 20.5 /100 | #201 | Fair 9.4% |
| Immigrants | Sierra Leone | 19.6 /100 | #202 | Poor 9.4% |
| German Russians | 19.4 /100 | #203 | Poor 9.4% |
| Immigrants | Lebanon | 18.9 /100 | #204 | Poor 9.4% |
| Aleuts | 18.0 /100 | #205 | Poor 9.5% |
| Immigrants | South America | 18.0 /100 | #206 | Poor 9.5% |
| Sierra Leoneans | 15.6 /100 | #207 | Poor 9.5% |
| Immigrants | Eastern Africa | 15.1 /100 | #208 | Poor 9.5% |
| Immigrants | Uruguay | 14.0 /100 | #209 | Poor 9.5% |
| Alsatians | 11.3 /100 | #210 | Poor 9.6% |
Demographics Similar to Vietnamese by Family Poverty
In terms of family poverty, the demographic groups most similar to Vietnamese are Immigrants from Belize (11.5%, a difference of 0.19%), Immigrants from Barbados (11.5%, a difference of 0.24%), West Indian (11.5%, a difference of 0.25%), Senegalese (11.5%, a difference of 0.27%), and Haitian (11.5%, a difference of 0.31%).
| Demographics | Rating | Rank | Family Poverty |
| Belizeans | 0.0 /100 | #280 | Tragic 11.3% |
| Immigrants | West Indies | 0.0 /100 | #281 | Tragic 11.3% |
| Immigrants | Cuba | 0.0 /100 | #282 | Tragic 11.3% |
| Indonesians | 0.0 /100 | #283 | Tragic 11.3% |
| Yaqui | 0.0 /100 | #284 | Tragic 11.3% |
| Barbadians | 0.0 /100 | #285 | Tragic 11.3% |
| Senegalese | 0.0 /100 | #286 | Tragic 11.5% |
| Vietnamese | 0.0 /100 | #287 | Tragic 11.5% |
| Immigrants | Belize | 0.0 /100 | #288 | Tragic 11.5% |
| Immigrants | Barbados | 0.0 /100 | #289 | Tragic 11.5% |
| West Indians | 0.0 /100 | #290 | Tragic 11.5% |
| Haitians | 0.0 /100 | #291 | Tragic 11.5% |
| Immigrants | Somalia | 0.0 /100 | #292 | Tragic 11.5% |
| Immigrants | Cabo Verde | 0.0 /100 | #293 | Tragic 11.6% |
| Immigrants | St. Vincent and the Grenadines | 0.0 /100 | #294 | Tragic 11.6% |