French Canadian vs Immigrants from Australia Disability Age Under 5
COMPARE
French Canadian
Immigrants from Australia
Disability Age Under 5
Disability Age Under 5 Comparison
French Canadians
Immigrants from Australia
1.9%
DISABILITY AGE UNDER 5
0.0/ 100
METRIC RATING
331st/ 347
METRIC RANK
1.2%
DISABILITY AGE UNDER 5
94.4/ 100
METRIC RATING
112th/ 347
METRIC RANK
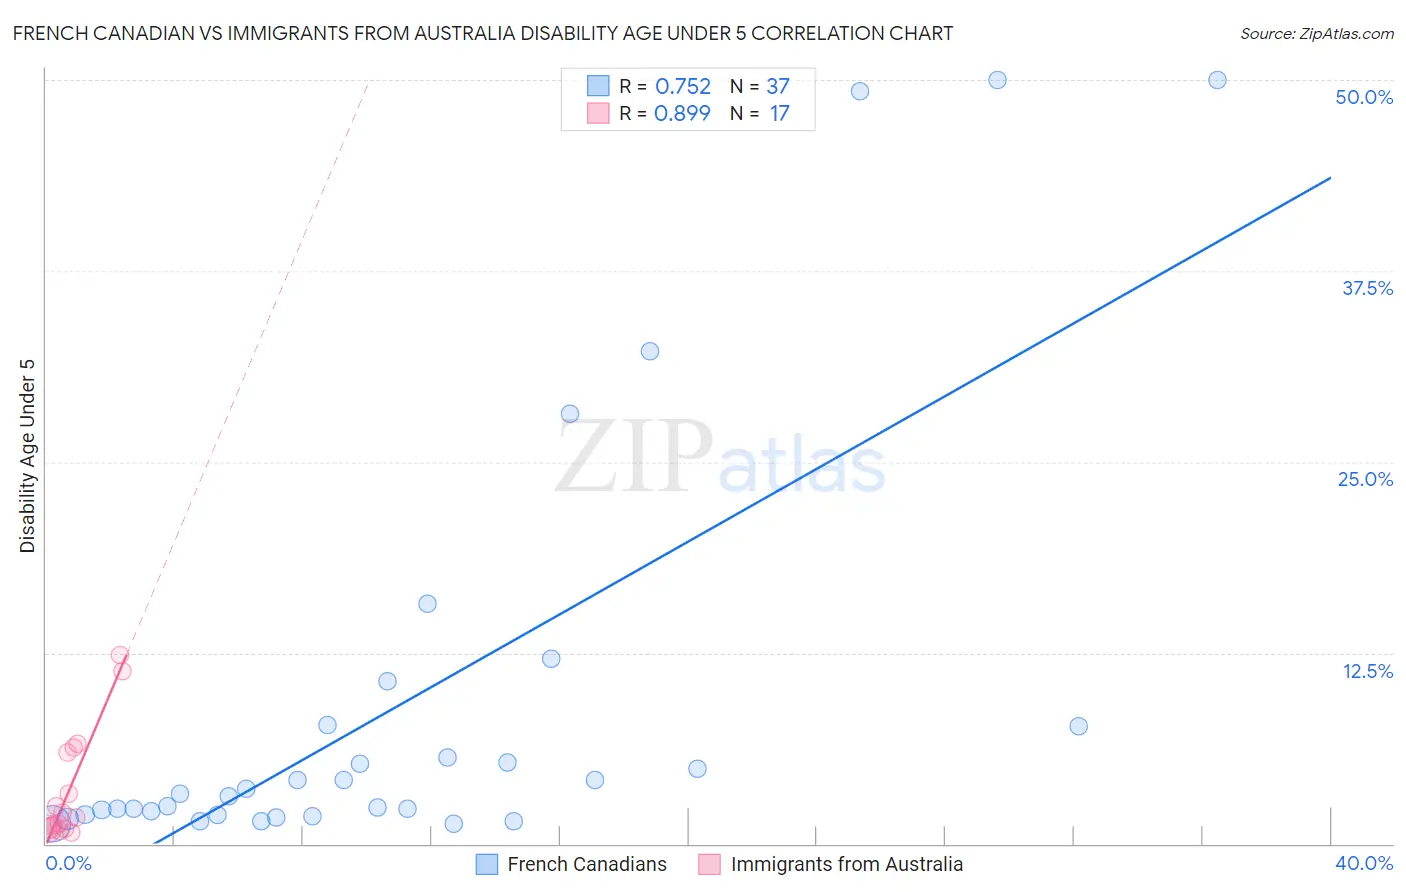
French Canadian vs Immigrants from Australia Disability Age Under 5 Correlation Chart
The statistical analysis conducted on geographies consisting of 244,253,201 people shows a strong positive correlation between the proportion of French Canadians and percentage of population with a disability under the age of 5 in the United States with a correlation coefficient (R) of 0.752 and weighted average of 1.9%. Similarly, the statistical analysis conducted on geographies consisting of 143,101,836 people shows a very strong positive correlation between the proportion of Immigrants from Australia and percentage of population with a disability under the age of 5 in the United States with a correlation coefficient (R) of 0.899 and weighted average of 1.2%, a difference of 61.8%.
Disability Age Under 5 Correlation Summary
| Measurement | French Canadian | Immigrants from Australia |
| Minimum | 1.3% | 0.73% |
| Maximum | 50.0% | 12.4% |
| Range | 48.7% | 11.7% |
| Mean | 9.2% | 3.5% |
| Median | 3.3% | 1.7% |
| Interquartile 25% (IQ1) | 1.9% | 1.0% |
| Interquartile 75% (IQ3) | 7.7% | 6.1% |
| Interquartile Range (IQR) | 5.8% | 5.1% |
| Standard Deviation (Sample) | 14.0% | 3.7% |
| Standard Deviation (Population) | 13.8% | 3.6% |
Similar Demographics by Disability Age Under 5
Demographics Similar to French Canadians by Disability Age Under 5
In terms of disability age under 5, the demographic groups most similar to French Canadians are Chippewa (1.9%, a difference of 0.060%), Choctaw (1.9%, a difference of 0.30%), Houma (1.9%, a difference of 0.62%), American (1.9%, a difference of 1.1%), and Osage (1.8%, a difference of 2.8%).
| Demographics | Rating | Rank | Disability Age Under 5 |
| Cherokee | 0.0 /100 | #324 | Tragic 1.8% |
| Immigrants | Portugal | 0.0 /100 | #325 | Tragic 1.8% |
| Sioux | 0.0 /100 | #326 | Tragic 1.8% |
| Osage | 0.0 /100 | #327 | Tragic 1.8% |
| Americans | 0.0 /100 | #328 | Tragic 1.9% |
| Houma | 0.0 /100 | #329 | Tragic 1.9% |
| Choctaw | 0.0 /100 | #330 | Tragic 1.9% |
| French Canadians | 0.0 /100 | #331 | Tragic 1.9% |
| Chippewa | 0.0 /100 | #332 | Tragic 1.9% |
| Dutch West Indians | 0.0 /100 | #333 | Tragic 1.9% |
| Natives/Alaskans | 0.0 /100 | #334 | Tragic 1.9% |
| Pennsylvania Germans | 0.0 /100 | #335 | Tragic 1.9% |
| Paraguayans | 0.0 /100 | #336 | Tragic 2.0% |
| Apache | 0.0 /100 | #337 | Tragic 2.0% |
| Tohono O'odham | 0.0 /100 | #338 | Tragic 2.2% |
Demographics Similar to Immigrants from Australia by Disability Age Under 5
In terms of disability age under 5, the demographic groups most similar to Immigrants from Australia are Immigrants from Oceania (1.2%, a difference of 0.060%), Senegalese (1.2%, a difference of 0.11%), Belizean (1.2%, a difference of 0.21%), Immigrants from Caribbean (1.2%, a difference of 0.22%), and Immigrants from Northern Africa (1.2%, a difference of 0.24%).
| Demographics | Rating | Rank | Disability Age Under 5 |
| Immigrants | South Africa | 95.6 /100 | #105 | Exceptional 1.2% |
| Cambodians | 95.4 /100 | #106 | Exceptional 1.2% |
| Immigrants | West Indies | 95.3 /100 | #107 | Exceptional 1.2% |
| Iraqis | 95.1 /100 | #108 | Exceptional 1.2% |
| Immigrants | Panama | 95.0 /100 | #109 | Exceptional 1.2% |
| Immigrants | Lebanon | 95.0 /100 | #110 | Exceptional 1.2% |
| Senegalese | 94.6 /100 | #111 | Exceptional 1.2% |
| Immigrants | Australia | 94.4 /100 | #112 | Exceptional 1.2% |
| Immigrants | Oceania | 94.2 /100 | #113 | Exceptional 1.2% |
| Belizeans | 93.9 /100 | #114 | Exceptional 1.2% |
| Immigrants | Caribbean | 93.8 /100 | #115 | Exceptional 1.2% |
| Immigrants | Northern Africa | 93.8 /100 | #116 | Exceptional 1.2% |
| Immigrants | Philippines | 93.5 /100 | #117 | Exceptional 1.2% |
| Immigrants | Venezuela | 93.4 /100 | #118 | Exceptional 1.2% |
| Bhutanese | 92.5 /100 | #119 | Exceptional 1.2% |