French American Indian vs Immigrants from Turkey Ambulatory Disability
COMPARE
French American Indian
Immigrants from Turkey
Ambulatory Disability
Ambulatory Disability Comparison
French American Indians
Immigrants from Turkey
6.9%
AMBULATORY DISABILITY
0.0/ 100
METRIC RATING
297th/ 347
METRIC RANK
5.4%
AMBULATORY DISABILITY
100.0/ 100
METRIC RATING
30th/ 347
METRIC RANK
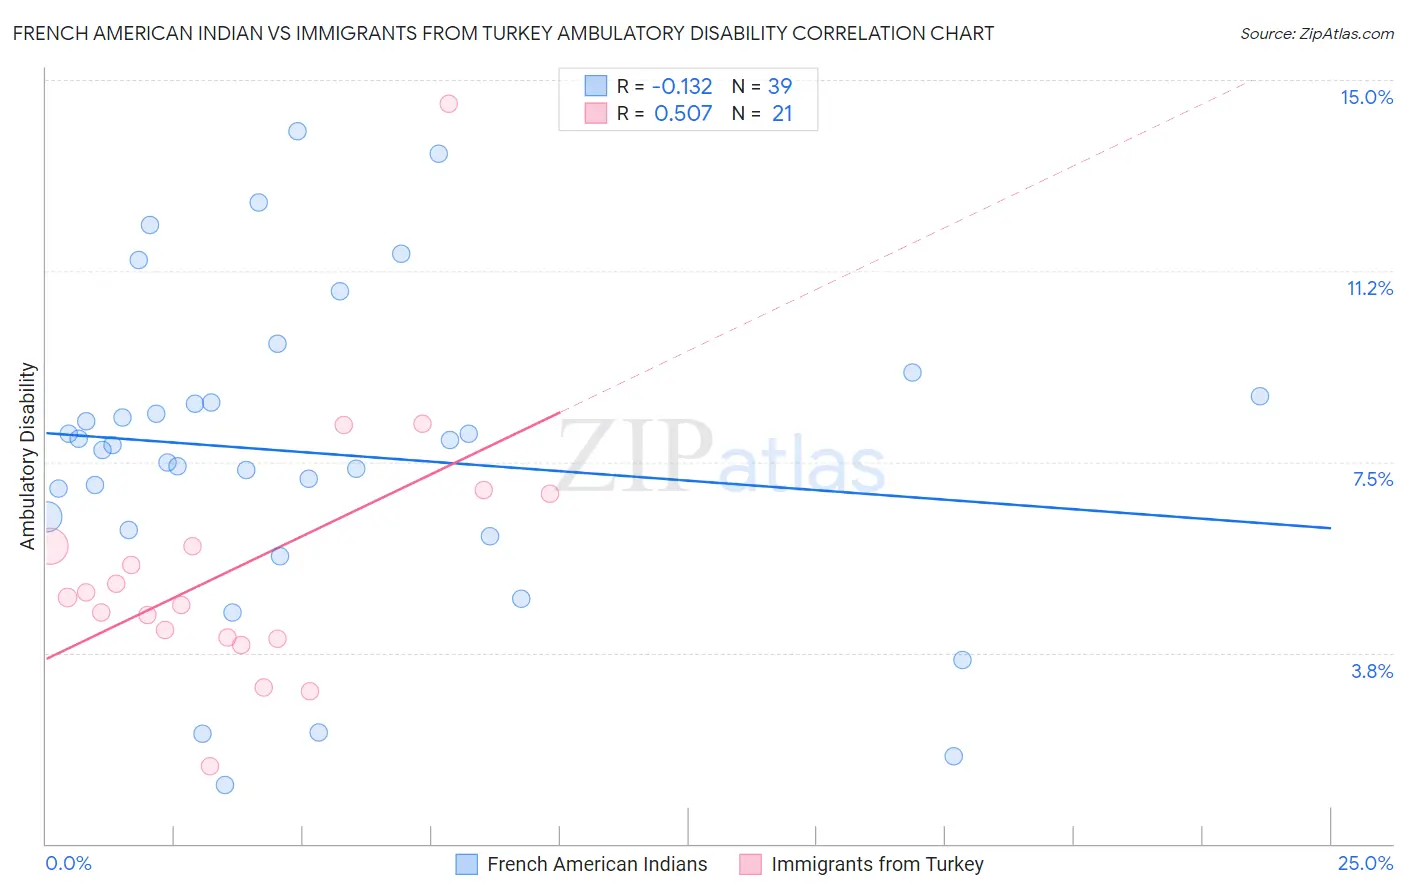
French American Indian vs Immigrants from Turkey Ambulatory Disability Correlation Chart
The statistical analysis conducted on geographies consisting of 131,970,739 people shows a poor negative correlation between the proportion of French American Indians and percentage of population with ambulatory disability in the United States with a correlation coefficient (R) of -0.132 and weighted average of 6.9%. Similarly, the statistical analysis conducted on geographies consisting of 223,019,564 people shows a substantial positive correlation between the proportion of Immigrants from Turkey and percentage of population with ambulatory disability in the United States with a correlation coefficient (R) of 0.507 and weighted average of 5.4%, a difference of 27.4%.
Ambulatory Disability Correlation Summary
| Measurement | French American Indian | Immigrants from Turkey |
| Minimum | 1.2% | 1.5% |
| Maximum | 14.0% | 14.5% |
| Range | 12.8% | 13.0% |
| Mean | 7.7% | 5.4% |
| Median | 7.8% | 4.8% |
| Interquartile 25% (IQ1) | 6.2% | 4.0% |
| Interquartile 75% (IQ3) | 8.8% | 6.4% |
| Interquartile Range (IQR) | 2.6% | 2.3% |
| Standard Deviation (Sample) | 3.1% | 2.7% |
| Standard Deviation (Population) | 3.0% | 2.6% |
Similar Demographics by Ambulatory Disability
Demographics Similar to French American Indians by Ambulatory Disability
In terms of ambulatory disability, the demographic groups most similar to French American Indians are Immigrants from Grenada (6.9%, a difference of 0.010%), Puget Sound Salish (6.9%, a difference of 0.14%), Marshallese (6.9%, a difference of 0.15%), Alaskan Athabascan (6.9%, a difference of 0.17%), and British West Indian (7.0%, a difference of 0.38%).
| Demographics | Rating | Rank | Ambulatory Disability |
| Scotch-Irish | 0.0 /100 | #290 | Tragic 6.9% |
| West Indians | 0.0 /100 | #291 | Tragic 6.9% |
| Cheyenne | 0.0 /100 | #292 | Tragic 6.9% |
| Immigrants | St. Vincent and the Grenadines | 0.0 /100 | #293 | Tragic 6.9% |
| Cape Verdeans | 0.0 /100 | #294 | Tragic 6.9% |
| Crow | 0.0 /100 | #295 | Tragic 6.9% |
| Alaskan Athabascans | 0.0 /100 | #296 | Tragic 6.9% |
| French American Indians | 0.0 /100 | #297 | Tragic 6.9% |
| Immigrants | Grenada | 0.0 /100 | #298 | Tragic 6.9% |
| Puget Sound Salish | 0.0 /100 | #299 | Tragic 6.9% |
| Marshallese | 0.0 /100 | #300 | Tragic 6.9% |
| British West Indians | 0.0 /100 | #301 | Tragic 7.0% |
| Immigrants | Armenia | 0.0 /100 | #302 | Tragic 7.0% |
| Africans | 0.0 /100 | #303 | Tragic 7.0% |
| Immigrants | Cabo Verde | 0.0 /100 | #304 | Tragic 7.0% |
Demographics Similar to Immigrants from Turkey by Ambulatory Disability
In terms of ambulatory disability, the demographic groups most similar to Immigrants from Turkey are Immigrants from Venezuela (5.4%, a difference of 0.020%), Immigrants from Australia (5.5%, a difference of 0.19%), Immigrants from Pakistan (5.5%, a difference of 0.31%), Immigrants from Asia (5.5%, a difference of 0.47%), and Afghan (5.5%, a difference of 0.51%).
| Demographics | Rating | Rank | Ambulatory Disability |
| Tongans | 100.0 /100 | #23 | Exceptional 5.4% |
| Immigrants | Saudi Arabia | 100.0 /100 | #24 | Exceptional 5.4% |
| Zimbabweans | 100.0 /100 | #25 | Exceptional 5.4% |
| Immigrants | Nepal | 100.0 /100 | #26 | Exceptional 5.4% |
| Asians | 100.0 /100 | #27 | Exceptional 5.4% |
| Cambodians | 100.0 /100 | #28 | Exceptional 5.4% |
| Immigrants | Iran | 100.0 /100 | #29 | Exceptional 5.4% |
| Immigrants | Turkey | 100.0 /100 | #30 | Exceptional 5.4% |
| Immigrants | Venezuela | 100.0 /100 | #31 | Exceptional 5.4% |
| Immigrants | Australia | 100.0 /100 | #32 | Exceptional 5.5% |
| Immigrants | Pakistan | 100.0 /100 | #33 | Exceptional 5.5% |
| Immigrants | Asia | 100.0 /100 | #34 | Exceptional 5.5% |
| Afghans | 100.0 /100 | #35 | Exceptional 5.5% |
| Immigrants | Malaysia | 100.0 /100 | #36 | Exceptional 5.5% |
| Turks | 100.0 /100 | #37 | Exceptional 5.5% |