Tsimshian vs Taiwanese Hearing Disability
COMPARE
Tsimshian
Taiwanese
Hearing Disability
Hearing Disability Comparison
Tsimshian
Taiwanese
4.7%
HEARING DISABILITY
0.0/ 100
METRIC RATING
342nd/ 347
METRIC RANK
2.8%
HEARING DISABILITY
94.8/ 100
METRIC RATING
102nd/ 347
METRIC RANK
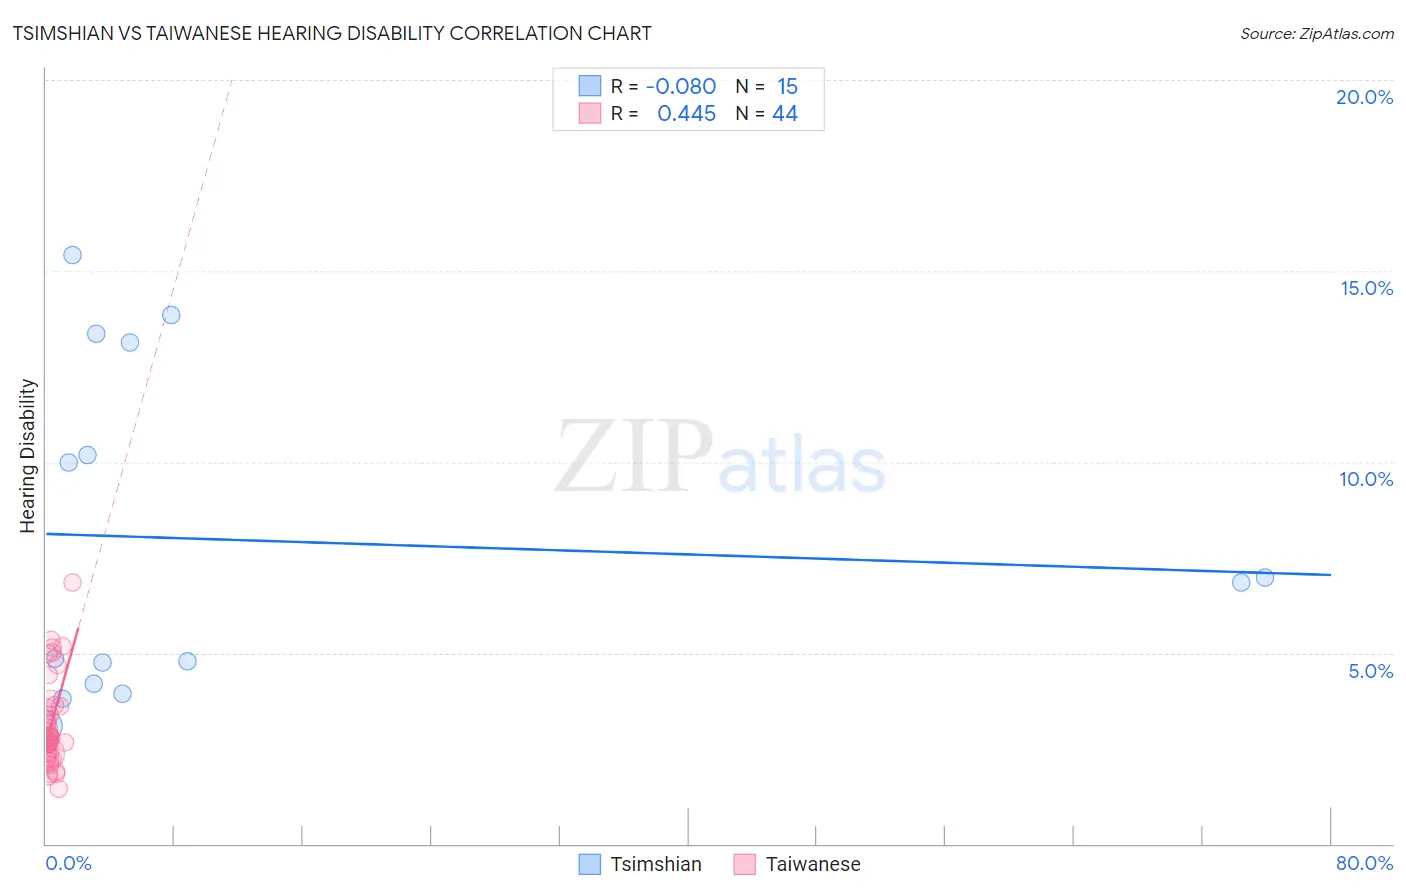
Tsimshian vs Taiwanese Hearing Disability Correlation Chart
The statistical analysis conducted on geographies consisting of 15,626,462 people shows a slight negative correlation between the proportion of Tsimshian and percentage of population with hearing disability in the United States with a correlation coefficient (R) of -0.080 and weighted average of 4.7%. Similarly, the statistical analysis conducted on geographies consisting of 31,724,936 people shows a moderate positive correlation between the proportion of Taiwanese and percentage of population with hearing disability in the United States with a correlation coefficient (R) of 0.445 and weighted average of 2.8%, a difference of 68.6%.
Hearing Disability Correlation Summary
| Measurement | Tsimshian | Taiwanese |
| Minimum | 3.1% | 1.5% |
| Maximum | 15.4% | 6.9% |
| Range | 12.3% | 5.4% |
| Mean | 7.9% | 3.1% |
| Median | 6.8% | 2.8% |
| Interquartile 25% (IQ1) | 4.2% | 2.4% |
| Interquartile 75% (IQ3) | 13.1% | 3.6% |
| Interquartile Range (IQR) | 8.9% | 1.2% |
| Standard Deviation (Sample) | 4.3% | 1.2% |
| Standard Deviation (Population) | 4.2% | 1.1% |
Similar Demographics by Hearing Disability
Demographics Similar to Tsimshian by Hearing Disability
In terms of hearing disability, the demographic groups most similar to Tsimshian are Inupiat (4.7%, a difference of 0.21%), Navajo (4.6%, a difference of 1.5%), Pueblo (4.6%, a difference of 1.9%), Tlingit-Haida (4.8%, a difference of 2.9%), and Choctaw (4.5%, a difference of 3.4%).
| Demographics | Rating | Rank | Hearing Disability |
| Dutch West Indians | 0.0 /100 | #333 | Tragic 4.3% |
| Aleuts | 0.0 /100 | #334 | Tragic 4.3% |
| Kiowa | 0.0 /100 | #335 | Tragic 4.3% |
| Creek | 0.0 /100 | #336 | Tragic 4.4% |
| Chickasaw | 0.0 /100 | #337 | Tragic 4.5% |
| Alaska Natives | 0.0 /100 | #338 | Tragic 4.5% |
| Choctaw | 0.0 /100 | #339 | Tragic 4.5% |
| Pueblo | 0.0 /100 | #340 | Tragic 4.6% |
| Navajo | 0.0 /100 | #341 | Tragic 4.6% |
| Tsimshian | 0.0 /100 | #342 | Tragic 4.7% |
| Inupiat | 0.0 /100 | #343 | Tragic 4.7% |
| Tlingit-Haida | 0.0 /100 | #344 | Tragic 4.8% |
| Alaskan Athabascans | 0.0 /100 | #345 | Tragic 5.3% |
| Colville | 0.0 /100 | #346 | Tragic 5.3% |
| Yup'ik | 0.0 /100 | #347 | Tragic 5.8% |
Demographics Similar to Taiwanese by Hearing Disability
In terms of hearing disability, the demographic groups most similar to Taiwanese are Immigrants from Spain (2.8%, a difference of 0.010%), Immigrants from Indonesia (2.8%, a difference of 0.050%), Immigrants from Eastern Africa (2.8%, a difference of 0.070%), Immigrants from Guatemala (2.8%, a difference of 0.12%), and Immigrants from Honduras (2.8%, a difference of 0.16%).
| Demographics | Rating | Rank | Hearing Disability |
| Israelis | 95.9 /100 | #95 | Exceptional 2.8% |
| Immigrants | Somalia | 95.5 /100 | #96 | Exceptional 2.8% |
| Immigrants | Afghanistan | 95.3 /100 | #97 | Exceptional 2.8% |
| Immigrants | Honduras | 95.1 /100 | #98 | Exceptional 2.8% |
| Immigrants | Guatemala | 95.1 /100 | #99 | Exceptional 2.8% |
| Immigrants | Eastern Africa | 95.0 /100 | #100 | Exceptional 2.8% |
| Immigrants | Spain | 94.9 /100 | #101 | Exceptional 2.8% |
| Taiwanese | 94.8 /100 | #102 | Exceptional 2.8% |
| Immigrants | Indonesia | 94.7 /100 | #103 | Exceptional 2.8% |
| Burmese | 94.2 /100 | #104 | Exceptional 2.8% |
| Moroccans | 93.9 /100 | #105 | Exceptional 2.8% |
| Hondurans | 93.4 /100 | #106 | Exceptional 2.8% |
| Immigrants | Chile | 93.4 /100 | #107 | Exceptional 2.8% |
| Guatemalans | 93.2 /100 | #108 | Exceptional 2.8% |
| Turks | 93.0 /100 | #109 | Exceptional 2.8% |