Finnish vs Immigrants from Uzbekistan Disability Age 18 to 34
COMPARE
Finnish
Immigrants from Uzbekistan
Disability Age 18 to 34
Disability Age 18 to 34 Comparison
Finns
Immigrants from Uzbekistan
7.8%
DISABILITY AGE 18 TO 34
0.0/ 100
METRIC RATING
310th/ 347
METRIC RANK
5.5%
DISABILITY AGE 18 TO 34
100.0/ 100
METRIC RATING
10th/ 347
METRIC RANK
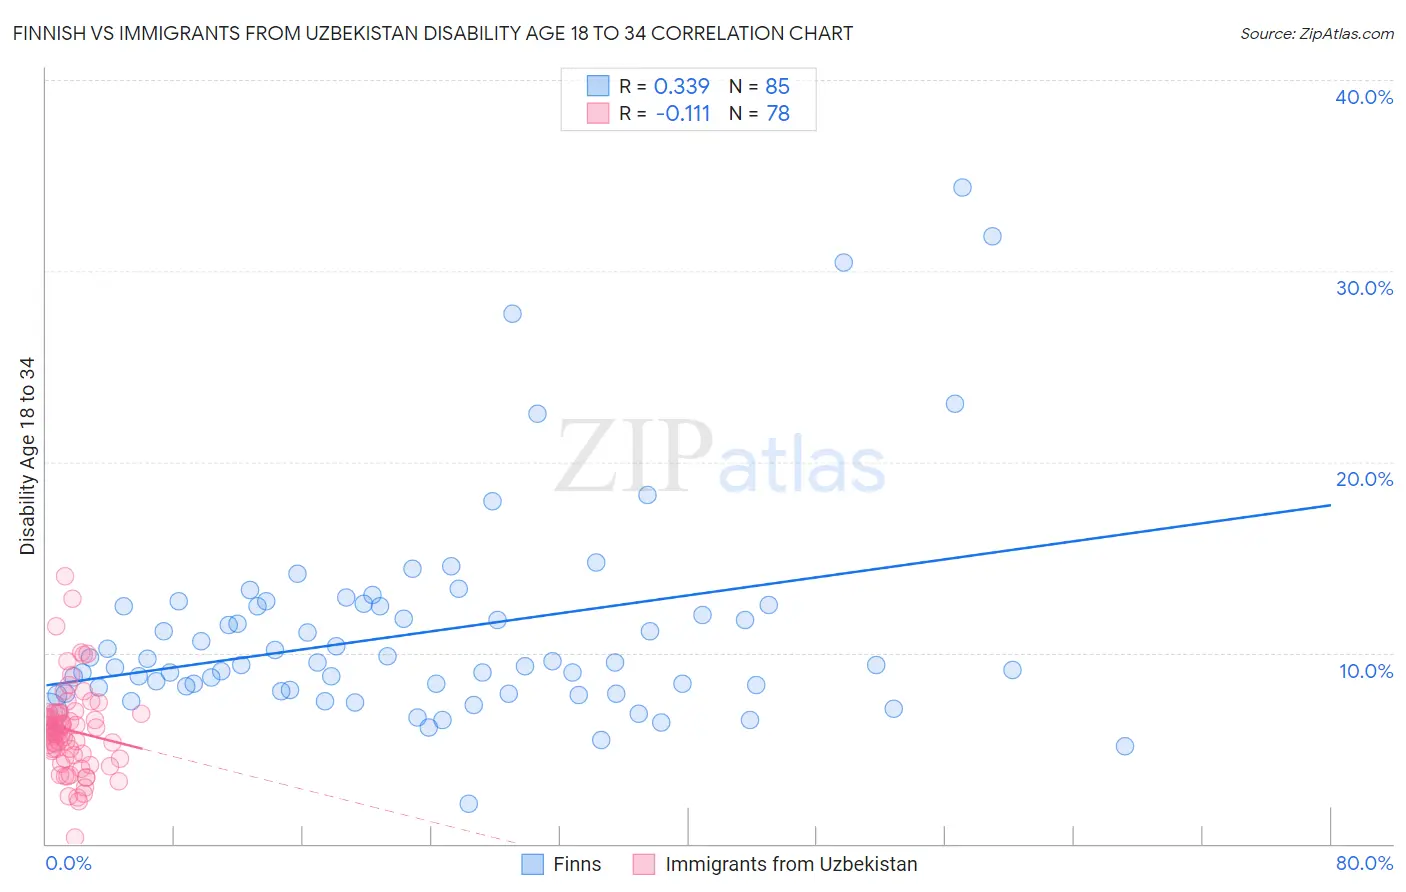
Finnish vs Immigrants from Uzbekistan Disability Age 18 to 34 Correlation Chart
The statistical analysis conducted on geographies consisting of 403,137,976 people shows a mild positive correlation between the proportion of Finns and percentage of population with a disability between the ages 18 and 35 in the United States with a correlation coefficient (R) of 0.339 and weighted average of 7.8%. Similarly, the statistical analysis conducted on geographies consisting of 118,643,782 people shows a poor negative correlation between the proportion of Immigrants from Uzbekistan and percentage of population with a disability between the ages 18 and 35 in the United States with a correlation coefficient (R) of -0.111 and weighted average of 5.5%, a difference of 41.6%.
Disability Age 18 to 34 Correlation Summary
| Measurement | Finnish | Immigrants from Uzbekistan |
| Minimum | 2.1% | 0.35% |
| Maximum | 34.4% | 14.0% |
| Range | 32.3% | 13.7% |
| Mean | 11.1% | 5.9% |
| Median | 9.4% | 5.9% |
| Interquartile 25% (IQ1) | 8.0% | 4.6% |
| Interquartile 75% (IQ3) | 12.4% | 6.8% |
| Interquartile Range (IQR) | 4.4% | 2.2% |
| Standard Deviation (Sample) | 5.6% | 2.3% |
| Standard Deviation (Population) | 5.6% | 2.3% |
Similar Demographics by Disability Age 18 to 34
Demographics Similar to Finns by Disability Age 18 to 34
In terms of disability age 18 to 34, the demographic groups most similar to Finns are Alaska Native (7.8%, a difference of 0.060%), Pennsylvania German (7.8%, a difference of 0.070%), Scotch-Irish (7.8%, a difference of 0.10%), English (7.8%, a difference of 0.35%), and Menominee (7.8%, a difference of 0.44%).
| Demographics | Rating | Rank | Disability Age 18 to 34 |
| Cheyenne | 0.0 /100 | #303 | Tragic 7.7% |
| Shoshone | 0.0 /100 | #304 | Tragic 7.8% |
| Menominee | 0.0 /100 | #305 | Tragic 7.8% |
| English | 0.0 /100 | #306 | Tragic 7.8% |
| Scotch-Irish | 0.0 /100 | #307 | Tragic 7.8% |
| Pennsylvania Germans | 0.0 /100 | #308 | Tragic 7.8% |
| Alaska Natives | 0.0 /100 | #309 | Tragic 7.8% |
| Finns | 0.0 /100 | #310 | Tragic 7.8% |
| French | 0.0 /100 | #311 | Tragic 7.9% |
| Spanish Americans | 0.0 /100 | #312 | Tragic 7.9% |
| Iroquois | 0.0 /100 | #313 | Tragic 7.9% |
| Colville | 0.0 /100 | #314 | Tragic 7.9% |
| Americans | 0.0 /100 | #315 | Tragic 8.0% |
| Puerto Ricans | 0.0 /100 | #316 | Tragic 8.0% |
| Hmong | 0.0 /100 | #317 | Tragic 8.1% |
Demographics Similar to Immigrants from Uzbekistan by Disability Age 18 to 34
In terms of disability age 18 to 34, the demographic groups most similar to Immigrants from Uzbekistan are Vietnamese (5.5%, a difference of 0.070%), Immigrants from St. Vincent and the Grenadines (5.5%, a difference of 0.13%), Guyanese (5.5%, a difference of 0.15%), Immigrants from Iran (5.5%, a difference of 0.45%), and Indian (Asian) (5.5%, a difference of 0.60%).
| Demographics | Rating | Rank | Disability Age 18 to 34 |
| Immigrants | Grenada | 100.0 /100 | #3 | Exceptional 5.3% |
| Immigrants | Cuba | 100.0 /100 | #4 | Exceptional 5.4% |
| Immigrants | Taiwan | 100.0 /100 | #5 | Exceptional 5.4% |
| Filipinos | 100.0 /100 | #6 | Exceptional 5.4% |
| Immigrants | China | 100.0 /100 | #7 | Exceptional 5.4% |
| Immigrants | Guyana | 100.0 /100 | #8 | Exceptional 5.5% |
| Guyanese | 100.0 /100 | #9 | Exceptional 5.5% |
| Immigrants | Uzbekistan | 100.0 /100 | #10 | Exceptional 5.5% |
| Vietnamese | 100.0 /100 | #11 | Exceptional 5.5% |
| Immigrants | St. Vincent and the Grenadines | 100.0 /100 | #12 | Exceptional 5.5% |
| Immigrants | Iran | 100.0 /100 | #13 | Exceptional 5.5% |
| Indians (Asian) | 100.0 /100 | #14 | Exceptional 5.5% |
| Immigrants | India | 100.0 /100 | #15 | Exceptional 5.6% |
| Immigrants | Israel | 100.0 /100 | #16 | Exceptional 5.6% |
| Immigrants | Eastern Asia | 100.0 /100 | #17 | Exceptional 5.6% |