Lebanese vs Immigrants from Sudan Vision Disability
COMPARE
Lebanese
Immigrants from Sudan
Vision Disability
Vision Disability Comparison
Lebanese
Immigrants from Sudan
2.2%
VISION DISABILITY
54.3/ 100
METRIC RATING
171st/ 347
METRIC RANK
2.1%
VISION DISABILITY
78.4/ 100
METRIC RATING
147th/ 347
METRIC RANK
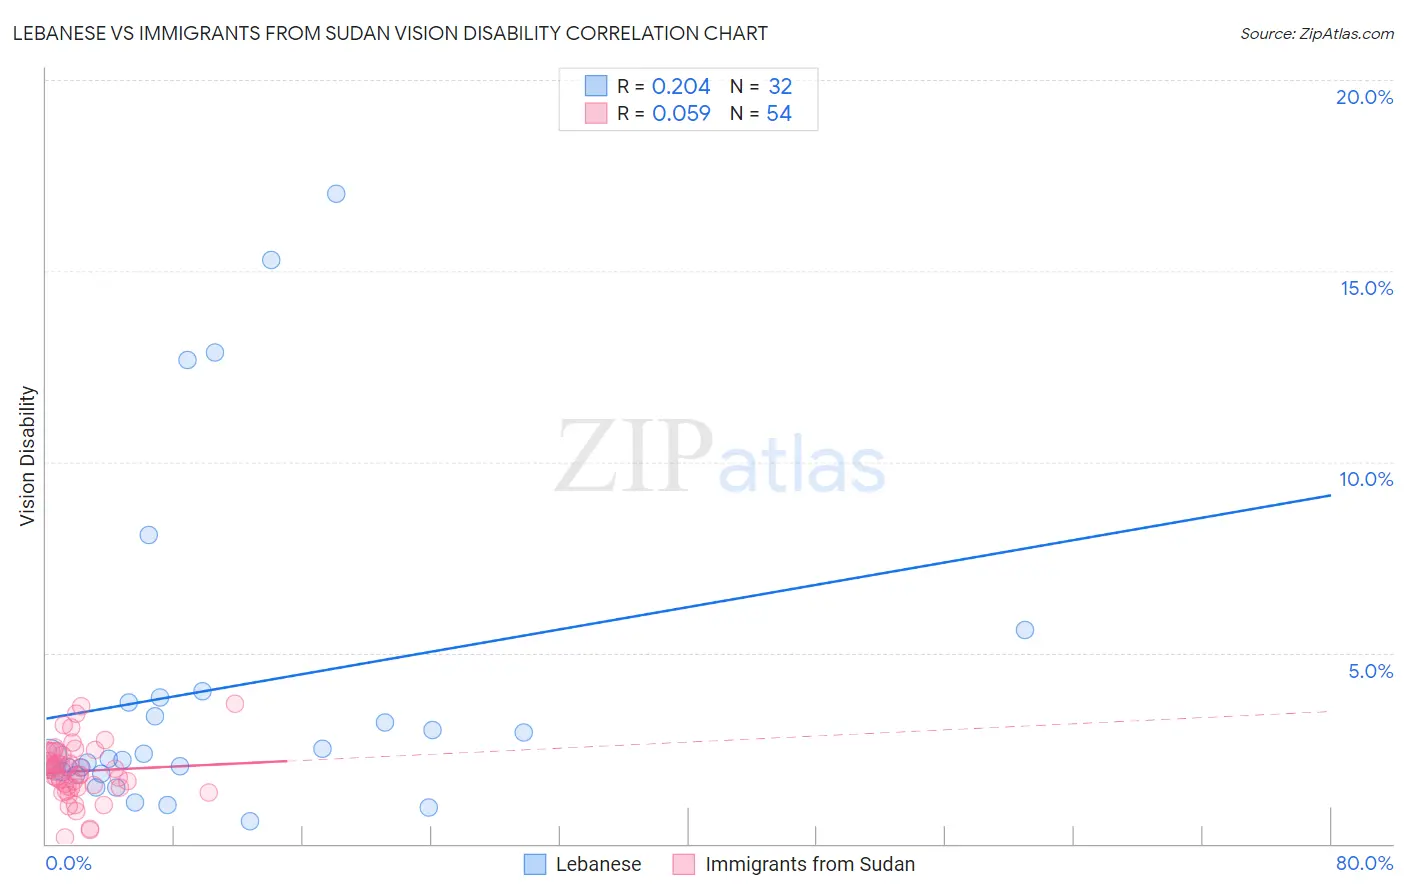
Lebanese vs Immigrants from Sudan Vision Disability Correlation Chart
The statistical analysis conducted on geographies consisting of 401,298,237 people shows a weak positive correlation between the proportion of Lebanese and percentage of population with vision disability in the United States with a correlation coefficient (R) of 0.204 and weighted average of 2.2%. Similarly, the statistical analysis conducted on geographies consisting of 118,945,827 people shows a slight positive correlation between the proportion of Immigrants from Sudan and percentage of population with vision disability in the United States with a correlation coefficient (R) of 0.059 and weighted average of 2.1%, a difference of 1.8%.
Vision Disability Correlation Summary
| Measurement | Lebanese | Immigrants from Sudan |
| Minimum | 0.58% | 0.17% |
| Maximum | 17.0% | 3.7% |
| Range | 16.4% | 3.5% |
| Mean | 4.0% | 1.9% |
| Median | 2.3% | 1.9% |
| Interquartile 25% (IQ1) | 1.9% | 1.5% |
| Interquartile 75% (IQ3) | 3.8% | 2.4% |
| Interquartile Range (IQR) | 1.9% | 0.90% |
| Standard Deviation (Sample) | 4.3% | 0.73% |
| Standard Deviation (Population) | 4.2% | 0.73% |
Similar Demographics by Vision Disability
Demographics Similar to Lebanese by Vision Disability
In terms of vision disability, the demographic groups most similar to Lebanese are Swiss (2.2%, a difference of 0.090%), South American Indian (2.2%, a difference of 0.20%), Northern European (2.2%, a difference of 0.26%), Scandinavian (2.2%, a difference of 0.27%), and Immigrants from Canada (2.2%, a difference of 0.27%).
| Demographics | Rating | Rank | Vision Disability |
| Immigrants | Bangladesh | 65.5 /100 | #164 | Good 2.1% |
| Immigrants | Iraq | 64.8 /100 | #165 | Good 2.1% |
| Immigrants | England | 62.8 /100 | #166 | Good 2.1% |
| Immigrants | Africa | 62.6 /100 | #167 | Good 2.1% |
| Brazilians | 62.2 /100 | #168 | Good 2.1% |
| South American Indians | 57.4 /100 | #169 | Average 2.2% |
| Swiss | 55.7 /100 | #170 | Average 2.2% |
| Lebanese | 54.3 /100 | #171 | Average 2.2% |
| Northern Europeans | 50.1 /100 | #172 | Average 2.2% |
| Scandinavians | 50.0 /100 | #173 | Average 2.2% |
| Immigrants | Canada | 50.0 /100 | #174 | Average 2.2% |
| Immigrants | Fiji | 47.6 /100 | #175 | Average 2.2% |
| Yugoslavians | 46.5 /100 | #176 | Average 2.2% |
| Slavs | 46.0 /100 | #177 | Average 2.2% |
| Immigrants | Oceania | 45.1 /100 | #178 | Average 2.2% |
Demographics Similar to Immigrants from Sudan by Vision Disability
In terms of vision disability, the demographic groups most similar to Immigrants from Sudan are Finnish (2.1%, a difference of 0.010%), Italian (2.1%, a difference of 0.13%), Colombian (2.1%, a difference of 0.20%), Belgian (2.1%, a difference of 0.23%), and Immigrants from Norway (2.1%, a difference of 0.26%).
| Demographics | Rating | Rank | Vision Disability |
| Immigrants | Netherlands | 84.2 /100 | #140 | Excellent 2.1% |
| Sierra Leoneans | 84.1 /100 | #141 | Excellent 2.1% |
| South Americans | 82.8 /100 | #142 | Excellent 2.1% |
| Immigrants | Sierra Leone | 82.8 /100 | #143 | Excellent 2.1% |
| Ukrainians | 81.9 /100 | #144 | Excellent 2.1% |
| Immigrants | Bosnia and Herzegovina | 81.5 /100 | #145 | Excellent 2.1% |
| Italians | 79.7 /100 | #146 | Good 2.1% |
| Immigrants | Sudan | 78.4 /100 | #147 | Good 2.1% |
| Finns | 78.3 /100 | #148 | Good 2.1% |
| Colombians | 76.2 /100 | #149 | Good 2.1% |
| Belgians | 75.9 /100 | #150 | Good 2.1% |
| Immigrants | Norway | 75.5 /100 | #151 | Good 2.1% |
| Immigrants | Southern Europe | 74.6 /100 | #152 | Good 2.1% |
| Immigrants | South America | 73.8 /100 | #153 | Good 2.1% |
| Slovenes | 73.6 /100 | #154 | Good 2.1% |