Bangladeshi vs Immigrants from Sudan Vision Disability
COMPARE
Bangladeshi
Immigrants from Sudan
Vision Disability
Vision Disability Comparison
Bangladeshis
Immigrants from Sudan
2.3%
VISION DISABILITY
0.5/ 100
METRIC RATING
250th/ 347
METRIC RANK
2.1%
VISION DISABILITY
78.4/ 100
METRIC RATING
147th/ 347
METRIC RANK
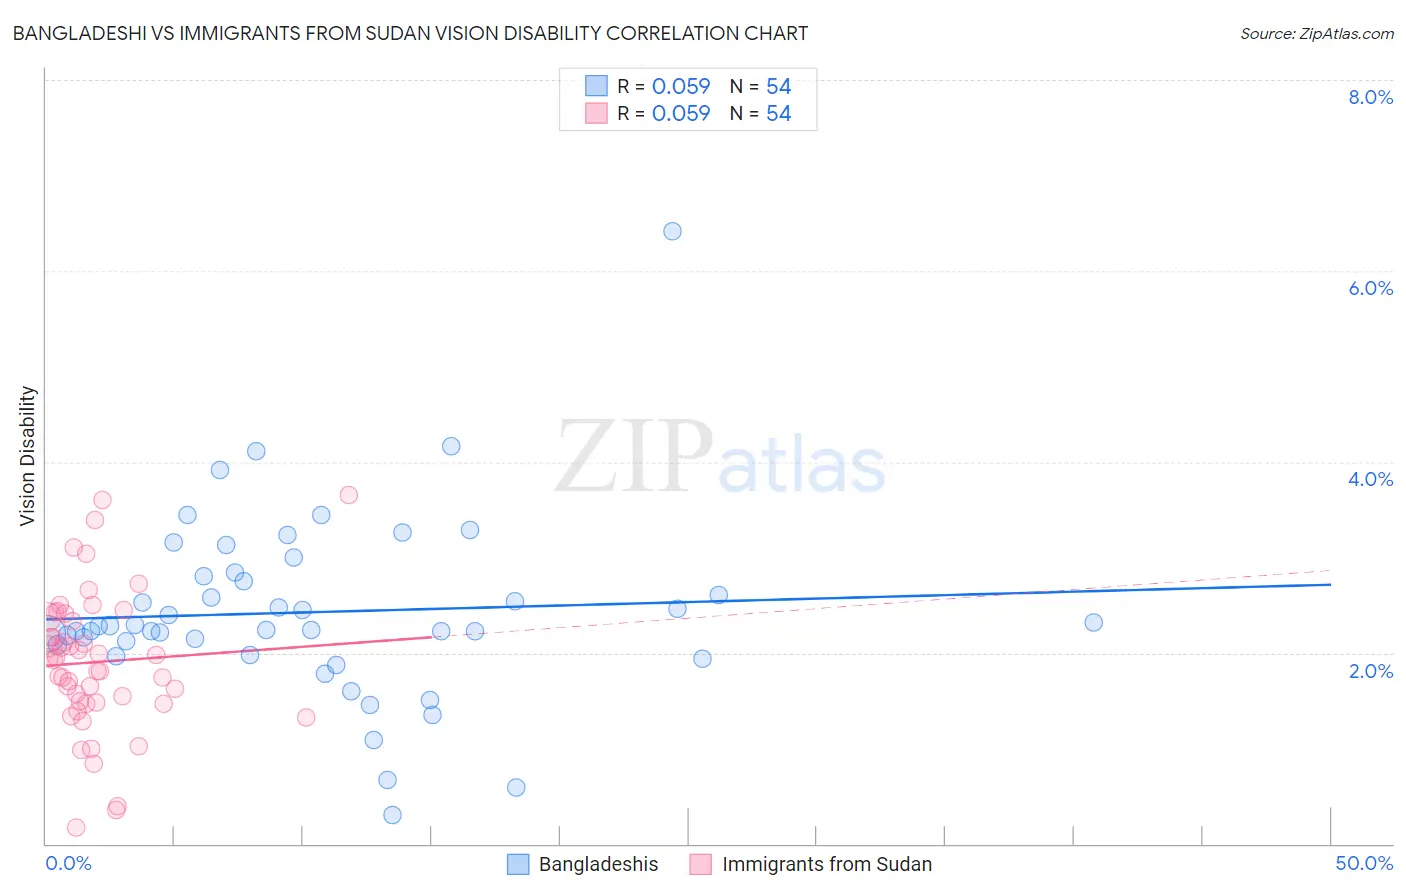
Bangladeshi vs Immigrants from Sudan Vision Disability Correlation Chart
The statistical analysis conducted on geographies consisting of 141,342,048 people shows a slight positive correlation between the proportion of Bangladeshis and percentage of population with vision disability in the United States with a correlation coefficient (R) of 0.059 and weighted average of 2.3%. Similarly, the statistical analysis conducted on geographies consisting of 118,945,827 people shows a slight positive correlation between the proportion of Immigrants from Sudan and percentage of population with vision disability in the United States with a correlation coefficient (R) of 0.059 and weighted average of 2.1%, a difference of 10.7%.
Vision Disability Correlation Summary
| Measurement | Bangladeshi | Immigrants from Sudan |
| Minimum | 0.30% | 0.17% |
| Maximum | 6.4% | 3.7% |
| Range | 6.1% | 3.5% |
| Mean | 2.4% | 1.9% |
| Median | 2.3% | 1.9% |
| Interquartile 25% (IQ1) | 2.1% | 1.5% |
| Interquartile 75% (IQ3) | 2.8% | 2.4% |
| Interquartile Range (IQR) | 0.72% | 0.90% |
| Standard Deviation (Sample) | 0.96% | 0.73% |
| Standard Deviation (Population) | 0.95% | 0.73% |
Similar Demographics by Vision Disability
Demographics Similar to Bangladeshis by Vision Disability
In terms of vision disability, the demographic groups most similar to Bangladeshis are Liberian (2.3%, a difference of 0.080%), Subsaharan African (2.3%, a difference of 0.10%), Immigrants from Laos (2.4%, a difference of 0.11%), Guatemalan (2.3%, a difference of 0.12%), and French (2.3%, a difference of 0.15%).
| Demographics | Rating | Rank | Vision Disability |
| Immigrants | Nicaragua | 0.6 /100 | #243 | Tragic 2.3% |
| Immigrants | West Indies | 0.6 /100 | #244 | Tragic 2.3% |
| Alsatians | 0.6 /100 | #245 | Tragic 2.3% |
| French | 0.5 /100 | #246 | Tragic 2.3% |
| Guatemalans | 0.5 /100 | #247 | Tragic 2.3% |
| Sub-Saharan Africans | 0.5 /100 | #248 | Tragic 2.3% |
| Liberians | 0.5 /100 | #249 | Tragic 2.3% |
| Bangladeshis | 0.5 /100 | #250 | Tragic 2.3% |
| Immigrants | Laos | 0.4 /100 | #251 | Tragic 2.4% |
| Immigrants | Micronesia | 0.3 /100 | #252 | Tragic 2.4% |
| Japanese | 0.3 /100 | #253 | Tragic 2.4% |
| Haitians | 0.3 /100 | #254 | Tragic 2.4% |
| Immigrants | Guatemala | 0.3 /100 | #255 | Tragic 2.4% |
| Immigrants | Haiti | 0.2 /100 | #256 | Tragic 2.4% |
| West Indians | 0.2 /100 | #257 | Tragic 2.4% |
Demographics Similar to Immigrants from Sudan by Vision Disability
In terms of vision disability, the demographic groups most similar to Immigrants from Sudan are Finnish (2.1%, a difference of 0.010%), Italian (2.1%, a difference of 0.13%), Colombian (2.1%, a difference of 0.20%), Belgian (2.1%, a difference of 0.23%), and Immigrants from Norway (2.1%, a difference of 0.26%).
| Demographics | Rating | Rank | Vision Disability |
| Immigrants | Netherlands | 84.2 /100 | #140 | Excellent 2.1% |
| Sierra Leoneans | 84.1 /100 | #141 | Excellent 2.1% |
| South Americans | 82.8 /100 | #142 | Excellent 2.1% |
| Immigrants | Sierra Leone | 82.8 /100 | #143 | Excellent 2.1% |
| Ukrainians | 81.9 /100 | #144 | Excellent 2.1% |
| Immigrants | Bosnia and Herzegovina | 81.5 /100 | #145 | Excellent 2.1% |
| Italians | 79.7 /100 | #146 | Good 2.1% |
| Immigrants | Sudan | 78.4 /100 | #147 | Good 2.1% |
| Finns | 78.3 /100 | #148 | Good 2.1% |
| Colombians | 76.2 /100 | #149 | Good 2.1% |
| Belgians | 75.9 /100 | #150 | Good 2.1% |
| Immigrants | Norway | 75.5 /100 | #151 | Good 2.1% |
| Immigrants | Southern Europe | 74.6 /100 | #152 | Good 2.1% |
| Immigrants | South America | 73.8 /100 | #153 | Good 2.1% |
| Slovenes | 73.6 /100 | #154 | Good 2.1% |