Ukrainian vs Immigrants from Sudan Vision Disability
COMPARE
Ukrainian
Immigrants from Sudan
Vision Disability
Vision Disability Comparison
Ukrainians
Immigrants from Sudan
2.1%
VISION DISABILITY
81.9/ 100
METRIC RATING
144th/ 347
METRIC RANK
2.1%
VISION DISABILITY
78.4/ 100
METRIC RATING
147th/ 347
METRIC RANK
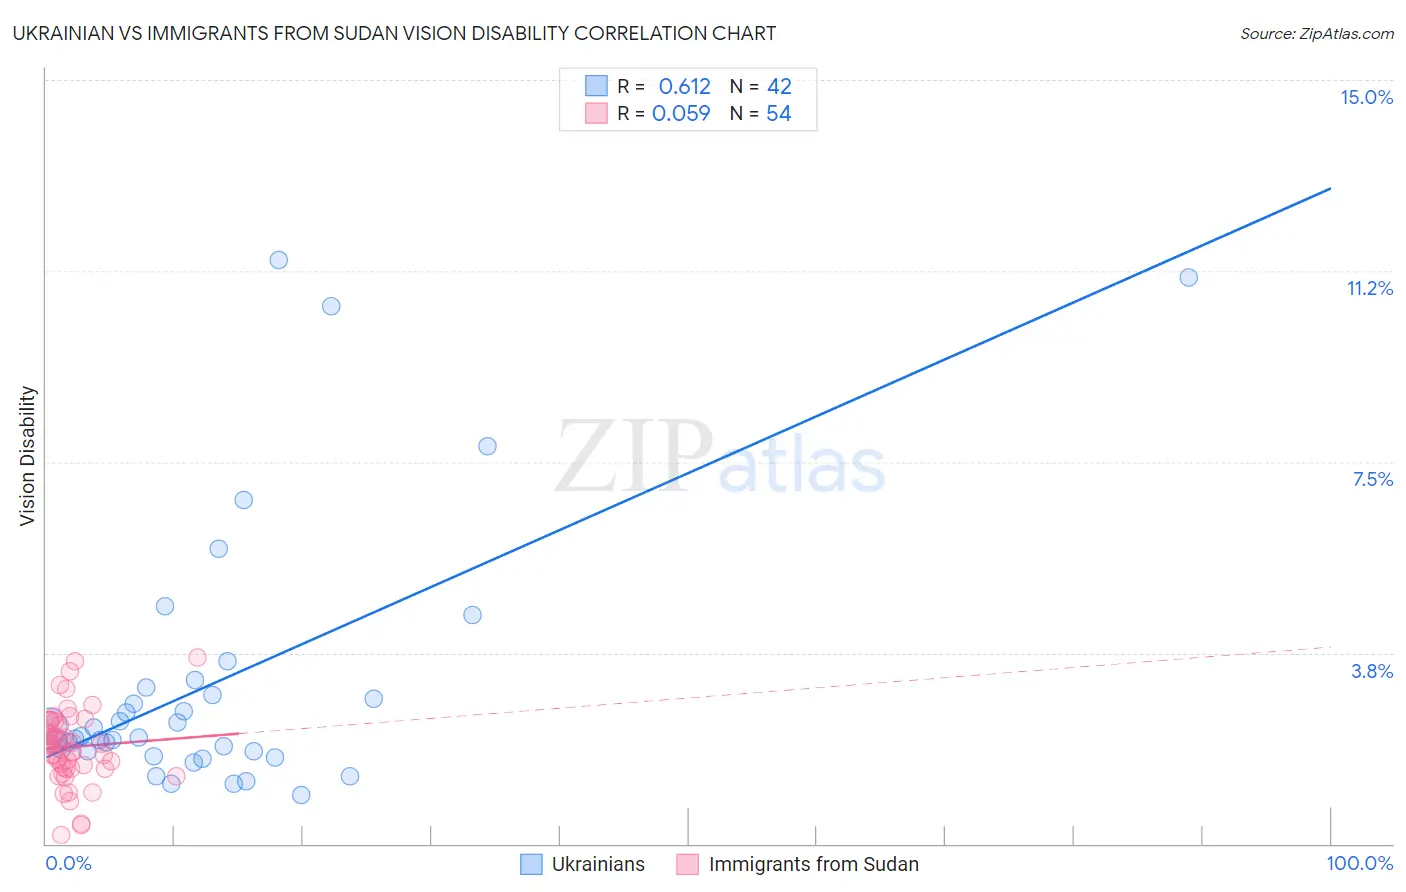
Ukrainian vs Immigrants from Sudan Vision Disability Correlation Chart
The statistical analysis conducted on geographies consisting of 448,040,924 people shows a significant positive correlation between the proportion of Ukrainians and percentage of population with vision disability in the United States with a correlation coefficient (R) of 0.612 and weighted average of 2.1%. Similarly, the statistical analysis conducted on geographies consisting of 118,945,827 people shows a slight positive correlation between the proportion of Immigrants from Sudan and percentage of population with vision disability in the United States with a correlation coefficient (R) of 0.059 and weighted average of 2.1%, a difference of 0.35%.
Vision Disability Correlation Summary
| Measurement | Ukrainian | Immigrants from Sudan |
| Minimum | 0.95% | 0.17% |
| Maximum | 11.5% | 3.7% |
| Range | 10.5% | 3.5% |
| Mean | 3.2% | 1.9% |
| Median | 2.1% | 1.9% |
| Interquartile 25% (IQ1) | 1.8% | 1.5% |
| Interquartile 75% (IQ3) | 3.1% | 2.4% |
| Interquartile Range (IQR) | 1.2% | 0.90% |
| Standard Deviation (Sample) | 2.6% | 0.73% |
| Standard Deviation (Population) | 2.6% | 0.73% |
Demographics Similar to Ukrainians and Immigrants from Sudan by Vision Disability
In terms of vision disability, the demographic groups most similar to Ukrainians are Immigrants from Bosnia and Herzegovina (2.1%, a difference of 0.040%), South American (2.1%, a difference of 0.11%), Immigrants from Sierra Leone (2.1%, a difference of 0.11%), Italian (2.1%, a difference of 0.23%), and Sierra Leonean (2.1%, a difference of 0.25%). Similarly, the demographic groups most similar to Immigrants from Sudan are Finnish (2.1%, a difference of 0.010%), Italian (2.1%, a difference of 0.13%), Colombian (2.1%, a difference of 0.20%), Belgian (2.1%, a difference of 0.23%), and Immigrants from Norway (2.1%, a difference of 0.26%).
| Demographics | Rating | Rank | Vision Disability |
| Vietnamese | 86.7 /100 | #135 | Excellent 2.1% |
| Czechs | 86.3 /100 | #136 | Excellent 2.1% |
| Immigrants | South Eastern Asia | 86.3 /100 | #137 | Excellent 2.1% |
| Arabs | 86.3 /100 | #138 | Excellent 2.1% |
| Immigrants | Morocco | 85.2 /100 | #139 | Excellent 2.1% |
| Immigrants | Netherlands | 84.2 /100 | #140 | Excellent 2.1% |
| Sierra Leoneans | 84.1 /100 | #141 | Excellent 2.1% |
| South Americans | 82.8 /100 | #142 | Excellent 2.1% |
| Immigrants | Sierra Leone | 82.8 /100 | #143 | Excellent 2.1% |
| Ukrainians | 81.9 /100 | #144 | Excellent 2.1% |
| Immigrants | Bosnia and Herzegovina | 81.5 /100 | #145 | Excellent 2.1% |
| Italians | 79.7 /100 | #146 | Good 2.1% |
| Immigrants | Sudan | 78.4 /100 | #147 | Good 2.1% |
| Finns | 78.3 /100 | #148 | Good 2.1% |
| Colombians | 76.2 /100 | #149 | Good 2.1% |
| Belgians | 75.9 /100 | #150 | Good 2.1% |
| Immigrants | Norway | 75.5 /100 | #151 | Good 2.1% |
| Immigrants | Southern Europe | 74.6 /100 | #152 | Good 2.1% |
| Immigrants | South America | 73.8 /100 | #153 | Good 2.1% |
| Slovenes | 73.6 /100 | #154 | Good 2.1% |
| Immigrants | Colombia | 72.1 /100 | #155 | Good 2.1% |