European vs Immigrants from Nigeria In Labor Force | Age > 16
COMPARE
European
Immigrants from Nigeria
In Labor Force | Age > 16
In Labor Force | Age > 16 Comparison
Europeans
Immigrants from Nigeria
64.7%
IN LABOR FORCE | AGE > 16
8.3/ 100
METRIC RATING
226th/ 347
METRIC RANK
66.9%
IN LABOR FORCE | AGE > 16
100.0/ 100
METRIC RATING
38th/ 347
METRIC RANK
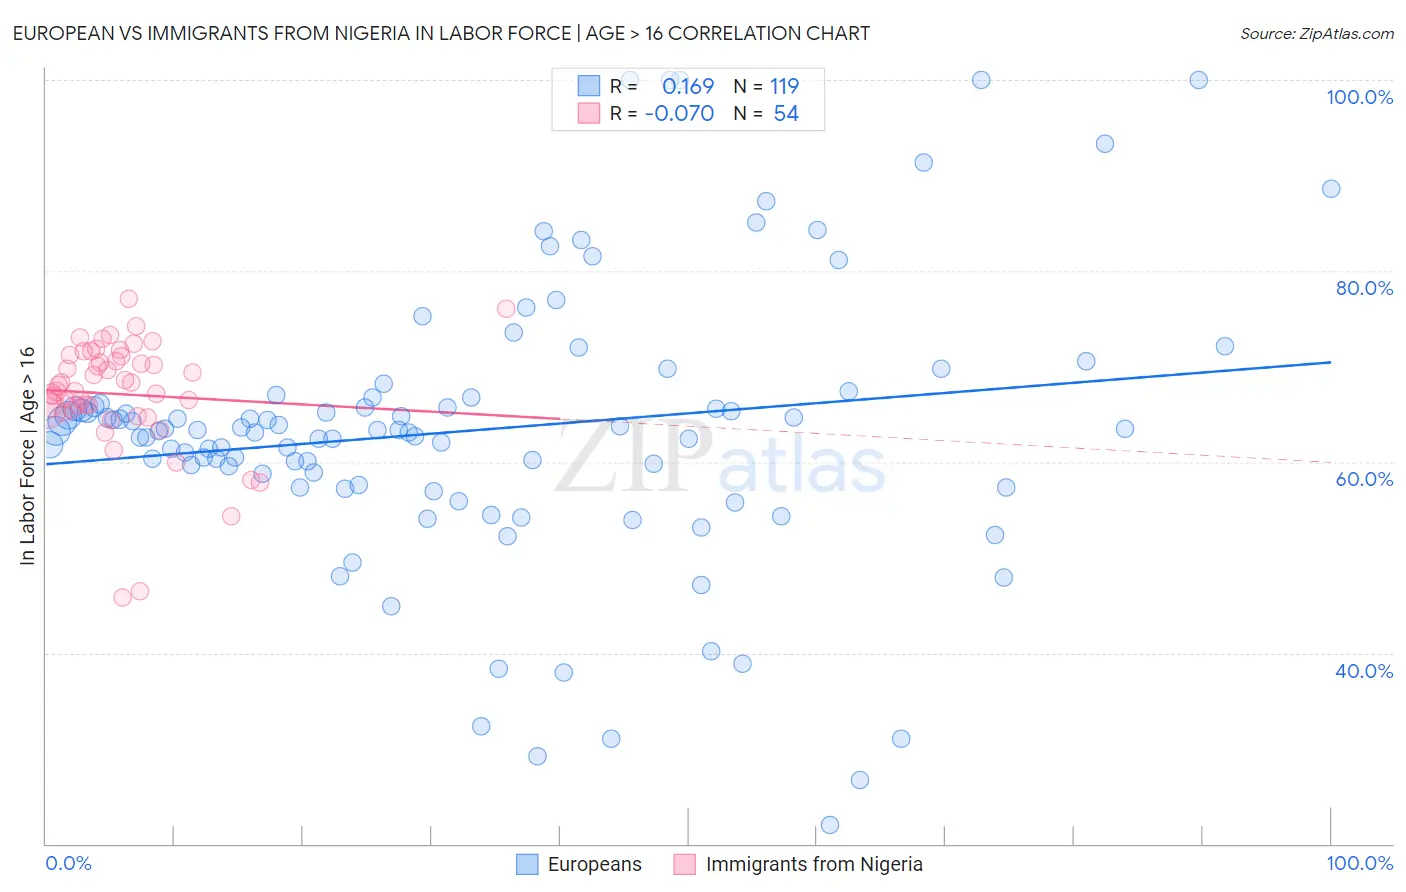
European vs Immigrants from Nigeria In Labor Force | Age > 16 Correlation Chart
The statistical analysis conducted on geographies consisting of 561,841,605 people shows a poor positive correlation between the proportion of Europeans and labor force participation rate among population ages 16 and over in the United States with a correlation coefficient (R) of 0.169 and weighted average of 64.7%. Similarly, the statistical analysis conducted on geographies consisting of 283,493,759 people shows a slight negative correlation between the proportion of Immigrants from Nigeria and labor force participation rate among population ages 16 and over in the United States with a correlation coefficient (R) of -0.070 and weighted average of 66.9%, a difference of 3.5%.
In Labor Force | Age > 16 Correlation Summary
| Measurement | European | Immigrants from Nigeria |
| Minimum | 22.0% | 45.8% |
| Maximum | 100.0% | 77.0% |
| Range | 78.0% | 31.2% |
| Mean | 63.4% | 67.1% |
| Median | 63.3% | 67.7% |
| Interquartile 25% (IQ1) | 57.6% | 65.4% |
| Interquartile 75% (IQ3) | 66.7% | 71.1% |
| Interquartile Range (IQR) | 9.1% | 5.7% |
| Standard Deviation (Sample) | 14.7% | 6.1% |
| Standard Deviation (Population) | 14.7% | 6.0% |
Similar Demographics by In Labor Force | Age > 16
Demographics Similar to Europeans by In Labor Force | Age > 16
In terms of in labor force | age > 16, the demographic groups most similar to Europeans are Polish (64.7%, a difference of 0.0%), Northern European (64.7%, a difference of 0.0%), Immigrants from Jamaica (64.7%, a difference of 0.020%), Croatian (64.7%, a difference of 0.020%), and Immigrants from Belize (64.7%, a difference of 0.030%).
| Demographics | Rating | Rank | In Labor Force | Age > 16 |
| Immigrants | Central America | 10.5 /100 | #219 | Poor 64.7% |
| Alaska Natives | 9.9 /100 | #220 | Tragic 64.7% |
| Immigrants | Micronesia | 9.6 /100 | #221 | Tragic 64.7% |
| Hawaiians | 9.3 /100 | #222 | Tragic 64.7% |
| Immigrants | Belize | 9.2 /100 | #223 | Tragic 64.7% |
| Immigrants | Jamaica | 8.8 /100 | #224 | Tragic 64.7% |
| Croatians | 8.8 /100 | #225 | Tragic 64.7% |
| Europeans | 8.3 /100 | #226 | Tragic 64.7% |
| Poles | 8.3 /100 | #227 | Tragic 64.7% |
| Northern Europeans | 8.2 /100 | #228 | Tragic 64.7% |
| British | 7.3 /100 | #229 | Tragic 64.7% |
| Chinese | 7.3 /100 | #230 | Tragic 64.7% |
| Immigrants | Northern Europe | 7.2 /100 | #231 | Tragic 64.7% |
| Africans | 5.8 /100 | #232 | Tragic 64.6% |
| Slavs | 4.9 /100 | #233 | Tragic 64.6% |
Demographics Similar to Immigrants from Nigeria by In Labor Force | Age > 16
In terms of in labor force | age > 16, the demographic groups most similar to Immigrants from Nigeria are Immigrants from Afghanistan (67.0%, a difference of 0.12%), Salvadoran (66.8%, a difference of 0.16%), Immigrants from El Salvador (66.8%, a difference of 0.17%), Immigrants from Zimbabwe (66.8%, a difference of 0.17%), and Immigrants from South Central Asia (67.1%, a difference of 0.20%).
| Demographics | Rating | Rank | In Labor Force | Age > 16 |
| Ghanaians | 100.0 /100 | #31 | Exceptional 67.1% |
| Immigrants | Congo | 100.0 /100 | #32 | Exceptional 67.1% |
| Afghans | 100.0 /100 | #33 | Exceptional 67.1% |
| Immigrants | Ghana | 100.0 /100 | #34 | Exceptional 67.1% |
| Immigrants | South Central Asia | 100.0 /100 | #35 | Exceptional 67.1% |
| Immigrants | Western Africa | 100.0 /100 | #36 | Exceptional 67.1% |
| Immigrants | Afghanistan | 100.0 /100 | #37 | Exceptional 67.0% |
| Immigrants | Nigeria | 100.0 /100 | #38 | Exceptional 66.9% |
| Salvadorans | 100.0 /100 | #39 | Exceptional 66.8% |
| Immigrants | El Salvador | 100.0 /100 | #40 | Exceptional 66.8% |
| Immigrants | Zimbabwe | 100.0 /100 | #41 | Exceptional 66.8% |
| Senegalese | 100.0 /100 | #42 | Exceptional 66.7% |
| Luxembourgers | 100.0 /100 | #43 | Exceptional 66.7% |
| Immigrants | Pakistan | 100.0 /100 | #44 | Exceptional 66.7% |
| Immigrants | Brazil | 100.0 /100 | #45 | Exceptional 66.7% |