German vs Immigrants from Nigeria Female Disability
COMPARE
German
Immigrants from Nigeria
Female Disability
Female Disability Comparison
Germans
Immigrants from Nigeria
12.9%
FEMALE DISABILITY
0.1/ 100
METRIC RATING
272nd/ 347
METRIC RANK
11.8%
FEMALE DISABILITY
97.2/ 100
METRIC RATING
118th/ 347
METRIC RANK
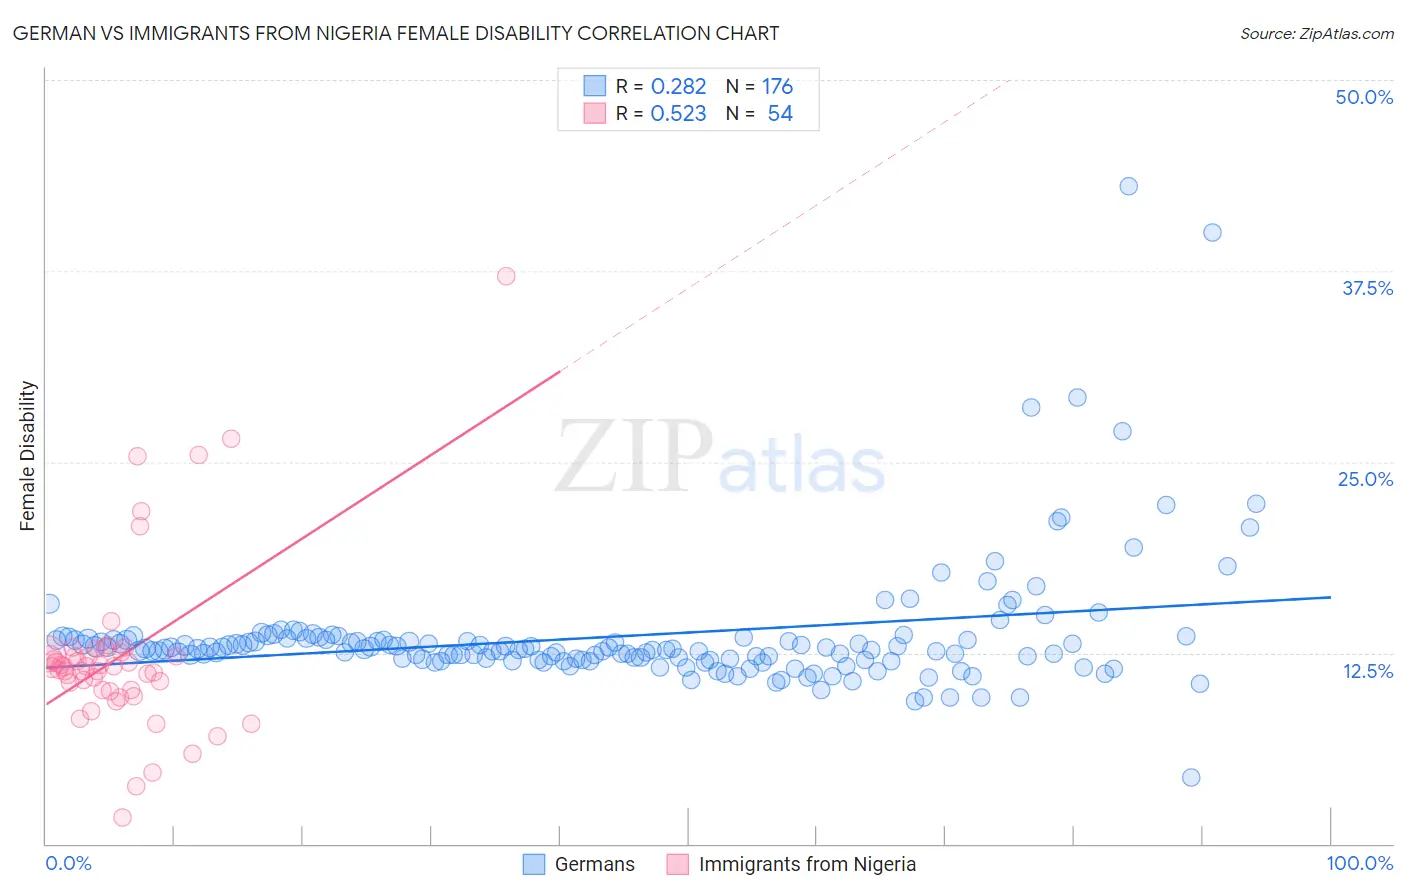
German vs Immigrants from Nigeria Female Disability Correlation Chart
The statistical analysis conducted on geographies consisting of 580,718,272 people shows a weak positive correlation between the proportion of Germans and percentage of females with a disability in the United States with a correlation coefficient (R) of 0.282 and weighted average of 12.9%. Similarly, the statistical analysis conducted on geographies consisting of 283,471,855 people shows a substantial positive correlation between the proportion of Immigrants from Nigeria and percentage of females with a disability in the United States with a correlation coefficient (R) of 0.523 and weighted average of 11.8%, a difference of 9.8%.
Female Disability Correlation Summary
| Measurement | German | Immigrants from Nigeria |
| Minimum | 4.3% | 1.7% |
| Maximum | 43.0% | 37.1% |
| Range | 38.7% | 35.4% |
| Mean | 13.6% | 12.3% |
| Median | 12.7% | 11.5% |
| Interquartile 25% (IQ1) | 12.1% | 10.1% |
| Interquartile 75% (IQ3) | 13.4% | 12.4% |
| Interquartile Range (IQR) | 1.3% | 2.3% |
| Standard Deviation (Sample) | 4.2% | 5.8% |
| Standard Deviation (Population) | 4.2% | 5.7% |
Similar Demographics by Female Disability
Demographics Similar to Germans by Female Disability
In terms of female disability, the demographic groups most similar to Germans are Sioux (12.9%, a difference of 0.020%), Portuguese (13.0%, a difference of 0.14%), Cheyenne (13.0%, a difference of 0.19%), Dutch (12.9%, a difference of 0.21%), and Immigrants from Dominica (13.0%, a difference of 0.24%).
| Demographics | Rating | Rank | Female Disability |
| West Indians | 0.5 /100 | #265 | Tragic 12.8% |
| Finns | 0.4 /100 | #266 | Tragic 12.8% |
| Senegalese | 0.4 /100 | #267 | Tragic 12.8% |
| Immigrants | Laos | 0.4 /100 | #268 | Tragic 12.8% |
| Indonesians | 0.4 /100 | #269 | Tragic 12.8% |
| Immigrants | Liberia | 0.3 /100 | #270 | Tragic 12.9% |
| Dutch | 0.2 /100 | #271 | Tragic 12.9% |
| Germans | 0.1 /100 | #272 | Tragic 12.9% |
| Sioux | 0.1 /100 | #273 | Tragic 12.9% |
| Portuguese | 0.1 /100 | #274 | Tragic 13.0% |
| Cheyenne | 0.1 /100 | #275 | Tragic 13.0% |
| Immigrants | Dominica | 0.1 /100 | #276 | Tragic 13.0% |
| Spanish | 0.1 /100 | #277 | Tragic 13.0% |
| Scottish | 0.1 /100 | #278 | Tragic 13.0% |
| Arapaho | 0.1 /100 | #279 | Tragic 13.0% |
Demographics Similar to Immigrants from Nigeria by Female Disability
In terms of female disability, the demographic groups most similar to Immigrants from Nigeria are Immigrants from Eastern Europe (11.8%, a difference of 0.0%), Immigrants from Uganda (11.8%, a difference of 0.010%), Immigrants from Kazakhstan (11.8%, a difference of 0.090%), Immigrants from Netherlands (11.8%, a difference of 0.11%), and Immigrants from North Macedonia (11.8%, a difference of 0.12%).
| Demographics | Rating | Rank | Female Disability |
| Costa Ricans | 98.1 /100 | #111 | Exceptional 11.7% |
| Immigrants | Bangladesh | 97.8 /100 | #112 | Exceptional 11.8% |
| Immigrants | Belarus | 97.8 /100 | #113 | Exceptional 11.8% |
| South Africans | 97.7 /100 | #114 | Exceptional 11.8% |
| Brazilians | 97.7 /100 | #115 | Exceptional 11.8% |
| Immigrants | Morocco | 97.6 /100 | #116 | Exceptional 11.8% |
| Immigrants | Eastern Europe | 97.2 /100 | #117 | Exceptional 11.8% |
| Immigrants | Nigeria | 97.2 /100 | #118 | Exceptional 11.8% |
| Immigrants | Uganda | 97.2 /100 | #119 | Exceptional 11.8% |
| Immigrants | Kazakhstan | 97.0 /100 | #120 | Exceptional 11.8% |
| Immigrants | Netherlands | 96.9 /100 | #121 | Exceptional 11.8% |
| Immigrants | North Macedonia | 96.8 /100 | #122 | Exceptional 11.8% |
| Immigrants | Croatia | 96.7 /100 | #123 | Exceptional 11.8% |
| Russians | 96.5 /100 | #124 | Exceptional 11.8% |
| Immigrants | Italy | 96.4 /100 | #125 | Exceptional 11.8% |